AirLive RS-2500 User Manual
Page 219
22. Monitor
AirLive RS-2500 User’s Manual
214
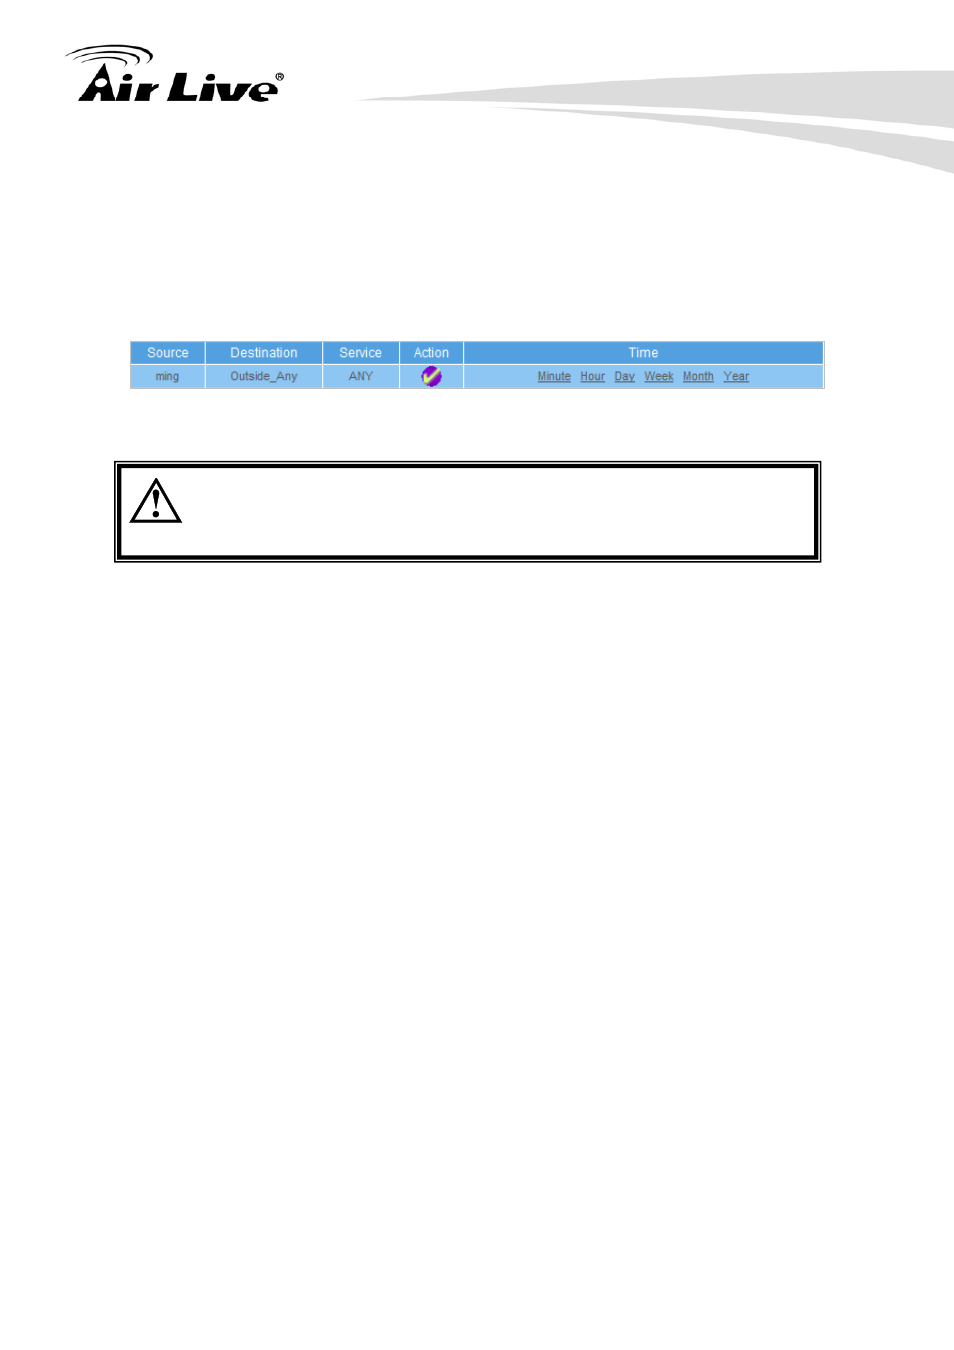
Policy Statistics:
STEP 1
﹒
If you had select Statistics in Policy, it will start to record the chart of that policy in
Policy Statistics. (Figure 22-24)
Figure 22-24 Policy Statistics Function
If you are going to use Policy Statistics function, the System
Manager has to enable the Statistics in Policy first.
STEP 2
﹒
In the Statistics WebUI, find the network you want to check and click Minute on
the right side, and then you will be able to check the Statistics chart every minute;
click Hour to check the Statistics chart every hour; click Day to check the Statistics
chart every day; click Week to check the Statistics figure every week; click Month
to check the Statistics figure every month; click Year to check the Statistics figure
every year.
STEP 3
﹒
Statistics Chart (Figure 22-25)
Y-Coordinate:Network Traffic(Kbytes/Sec)
X-Coordinate:Time(Hour/Minute/Day)
- AirMax5 (146 pages)
- AirMax5N (93 pages)
- AirMax5X (91 pages)
- AirVideo-100 (67 pages)
- AirVideo-100v2 (63 pages)
- AirVideo-2000 (31 pages)
- AP60 (101 pages)
- BT-201USB (63 pages)
- BT-302USB (52 pages)
- BU-3026 (64 pages)
- CamPro Professional (178 pages)
- CoreNVR 16 (55 pages)
- DS-100 (34 pages)
- DS-100 v2 (36 pages)
- ES-4000 v2 (168 pages)
- ES-6000 (221 pages)
- Ether-FSH2402NT (19 pages)
- Ether-FSH2422W (55 pages)
- Ether-GSH16TW (42 pages)
- Ether-GSH2404W (50 pages)
- Ether-GSH2416W (61 pages)
- Ether-GSH24T v.2 (16 pages)
- Ether-GSH24TW (42 pages)
- Ether-GSH8TW v2 (36 pages)
- EtherWe-1000U (15 pages)
- G.DUO (137 pages)
- HP-1000E v2 (13 pages)
- HP-2000E (29 pages)
- HP-3000E (15 pages)
- IAR-5000 v2 (202 pages)
- IAS-2000 (163 pages)
- IGR-1500 (78 pages)
- IGR-2500 (81 pages)
- Live-800G (16 pages)
- Live-GSH5T (25 pages)
- Live-GSH8T (25 pages)
- WFP-101U (133 pages)
- MU-5000FS A2 (42 pages)
- MW-2000S (225 pages)
- N.MINI (87 pages)
- N.Plug (103 pages)
- N.TOP (71 pages)
- NAS-235 (89 pages)
- NVR4 (85 pages)
- OD-2025HD (101 pages)