Connection statistics, Throughput, 151 viewing the connection statistics section – HP Secure Key Manager User Manual
Page 237: 134 system statistics section components, 135 connection statistics section components

Table 134 System Statistics section components
Component
Description
CPU Utilization (%)
This number represents the percentage of CPU time that was in use for each CPU at
the moment the System Statistics page was updated.
System Uptime
This field represents the duration of time that has elapsed since the SKM was last
rebooted.
Connection Statistics
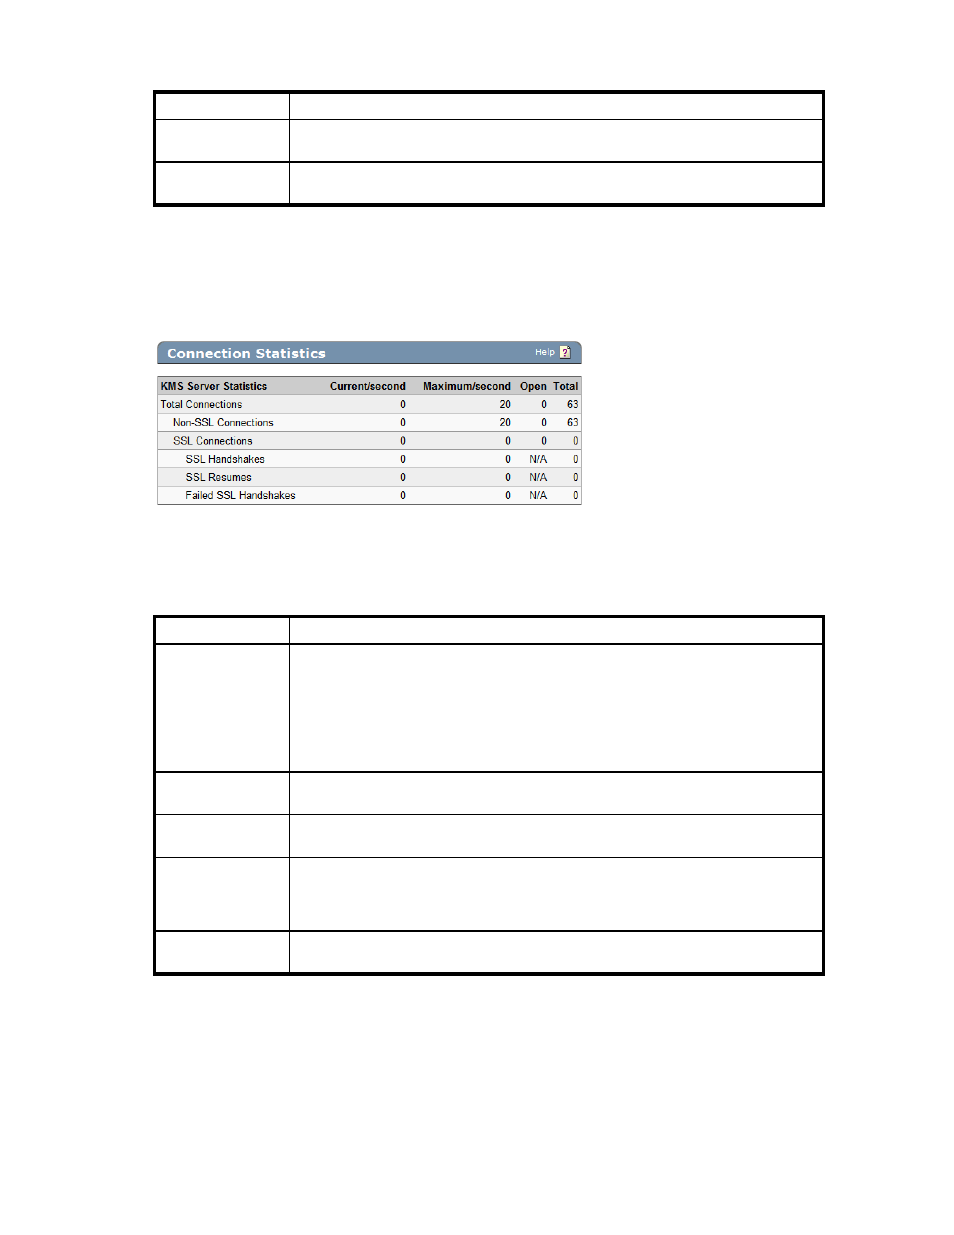
The Connection Statistics section provides information on the total number of connections since the
SKM was rebooted.
Figure 151 Viewing the Connection Statistics section
The following table describes the components of the Connection Statistics section.
Table 135 Connection Statistics section components
Component
Description
KMS Server
Statistics
Total Connections
•
Non–SSL Connections
•
SSL Connections
•
SSL Handshakes
•
SSL Resumes
•
Failed SSL Handshakes
Current/second
The Current per second column shows how many of a given statistic were counted on
the SKM in the second the System Statistics were refreshed.
Maximum/second
The Maximum per second column shows the maximum number of a given statistic that
were counted by the SKM during any one second.
Open
The Open column shows the current number of open connections on the SKM. Note
that this column never reflects the number of “open” SSL Handshakes, SSL Resumes,
or Failed SSL Handshakes. These are events that happen and therefore cannot be
counted as “open.”
Total
The Total column shows the cumulative number of a given statistic on the SKM since
the device was rebooted.
Throughput
The Throughput section shows statistics for data traffic on the KMS Server and data traffic on each
physical interface on the SKM.
Secure Key Manager
237
