Observer, Charts tab – Lincoln Electric IM8002 POWER WAVE MANAGER User Manual
Page 75
Observer
Chapter 9. Tools
IM8002
Power Wave® Manager User Manual
9.9
Observer
While WeldView gives a detailed view of a portion of a weld with a short duration, the Observer tool graphs
welding feedback at a slower rate over the course of several entire welds. When you begin a weld, Power
Wave® Manager displays a real-time view of the weld. The Observer tool also allows you to change some
basic welding parameters including the Group Schedule, Weld Mode, Workpoint, Trim and other values.
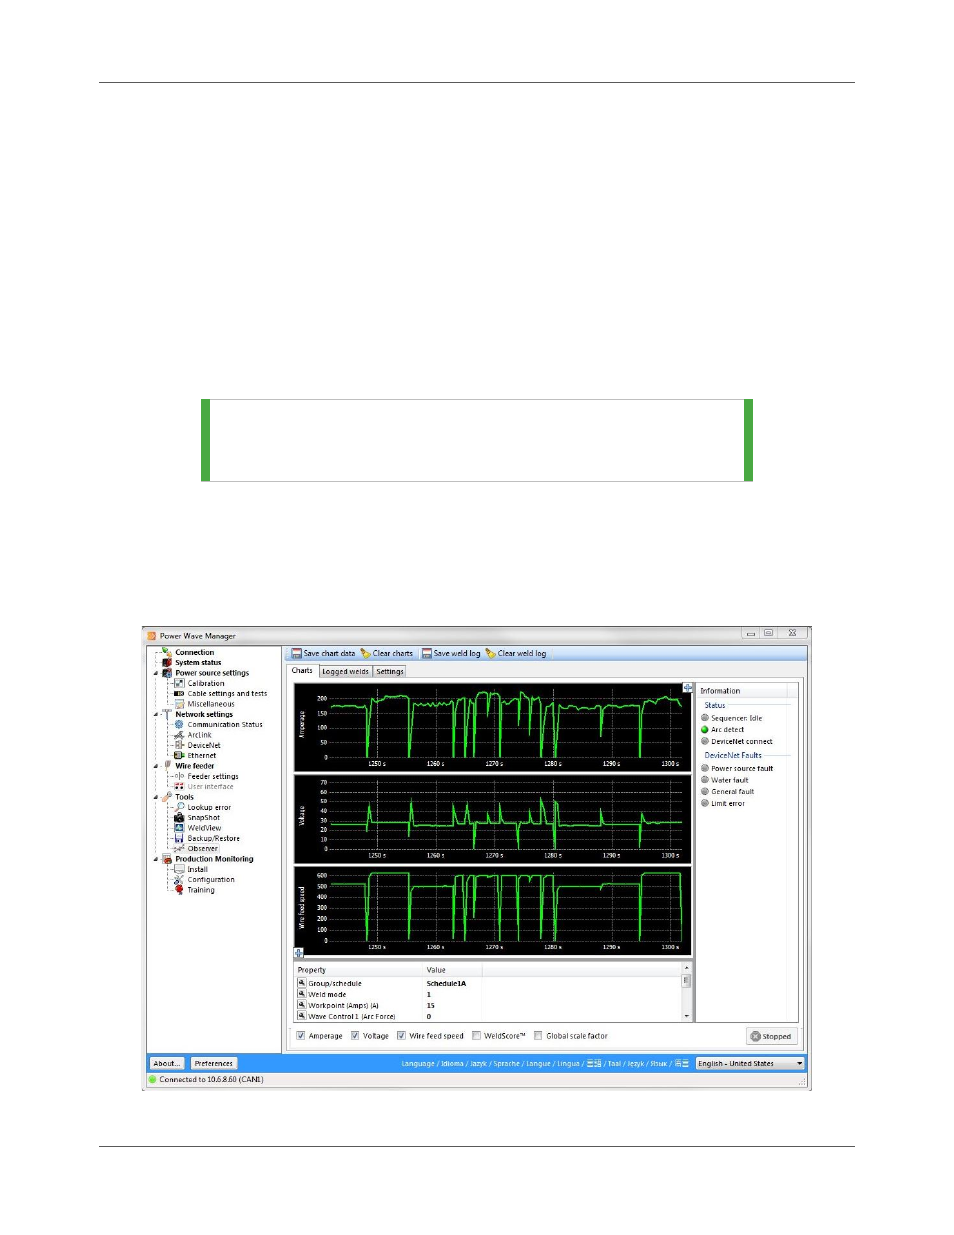
Charts Tab
Power Wave® Manager produces the plots on the Charts tab by periodically reading feedback values from
the Welding Power Source as it welds (Figure 9.8). The data updates whenever the Welding Power Source
output is on. The graphs display Amperage, Voltage, Wire Feed Speed, WeldScore™ (if available), and
Global Scale Factor.
TIP
|
The checkboxes at the bottom control which graphs you can
see on the Charts tab. Remove the check mark to hide the
graph. Replace the check mark to display it again.
The Information section of the tab displays the status of various system components connected to this
Welding Power Source (if supported). When the indicator is green, this means the status is good. If there is
a fault, the respective gray indicator changes to red.
The Arc detect indicator changes to green when it detects an arc and yellow if the output is on but the
system cannot detect any arc (e.g., when there is not enough voltage to create an arc).
Figure 9.8 Observer Tool