Weld data tab charts tab – Lincoln Electric IM8002 POWER WAVE MANAGER User Manual
Page 71
WeldView
Chapter 9. Tools
IM8002
Power Wave® Manager User Manual
9.5
Procedure
Details
4.
If you want the trace to begin only when a
specific event occurs, place a check mark in
the Use trigger checkbox.
You can skip to step 7 if you do not want to use a
trigger. Make sure there is no check mark in the
Use trigger checkbox.
5.
Select the event from the drop-down.
6.
Enter the specific value of the event in
the text field.
7.
Click Next.
The Perform weld step displays.
8.
Make the weld with the power source.
The status light on the Welding Power Source
changes to solid green to indicate the machine is
currently welding.
9.
Once you complete the weld, click the
Next button.
The power source transfers the data to Power
Wave® Manager and displays it on the Weld data
and Charts tabs.
TIP |
To transfer the data from the power
source manually or re-read the last trace made,
simply click the Read trace from power source
button.
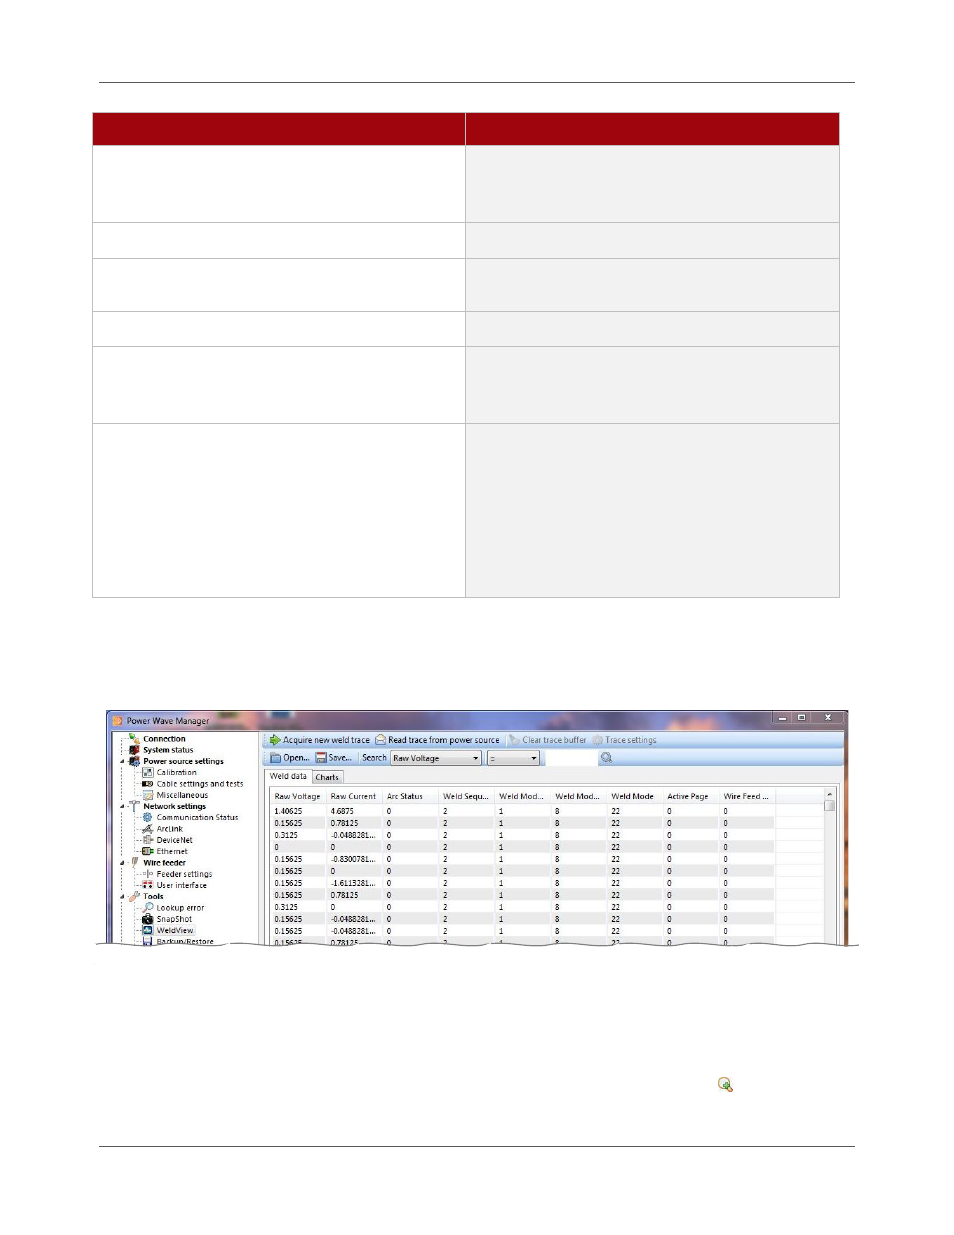
Weld Data Tab
On the Weld data tab, Power Wave® Manager displays the data collected from the weld trace in tabular
form. Scroll through the data to review the information (Figure 9.5).
Figure 9.5 WeldView Data in Tabular Form
Charts Tab
The Charts tab (Figure 9.3 on page 9.3) displays a line graph for each aspect of the weld you traced,
including raw voltage, raw current and more. You can scroll through the charts to review the information.
If you want to review the charts in more detail, click the zoom icons. The Zoom in icon ( ) displays the