FUJITSU ServerView Resource Orchestrator Cloud Edition V3.1.0 User Manual
Page 49
*2: The display interval can be switched to a shorter interval by clicking the data plotting area of a horizontal polyline graph, or switched
to a longer interval by clicking outside the data plotting area.
*3: Will not display if the VM host virtualization software used is either RHEL5-Xen, RHEL-KVM, or Solaris Zones.
Note
-
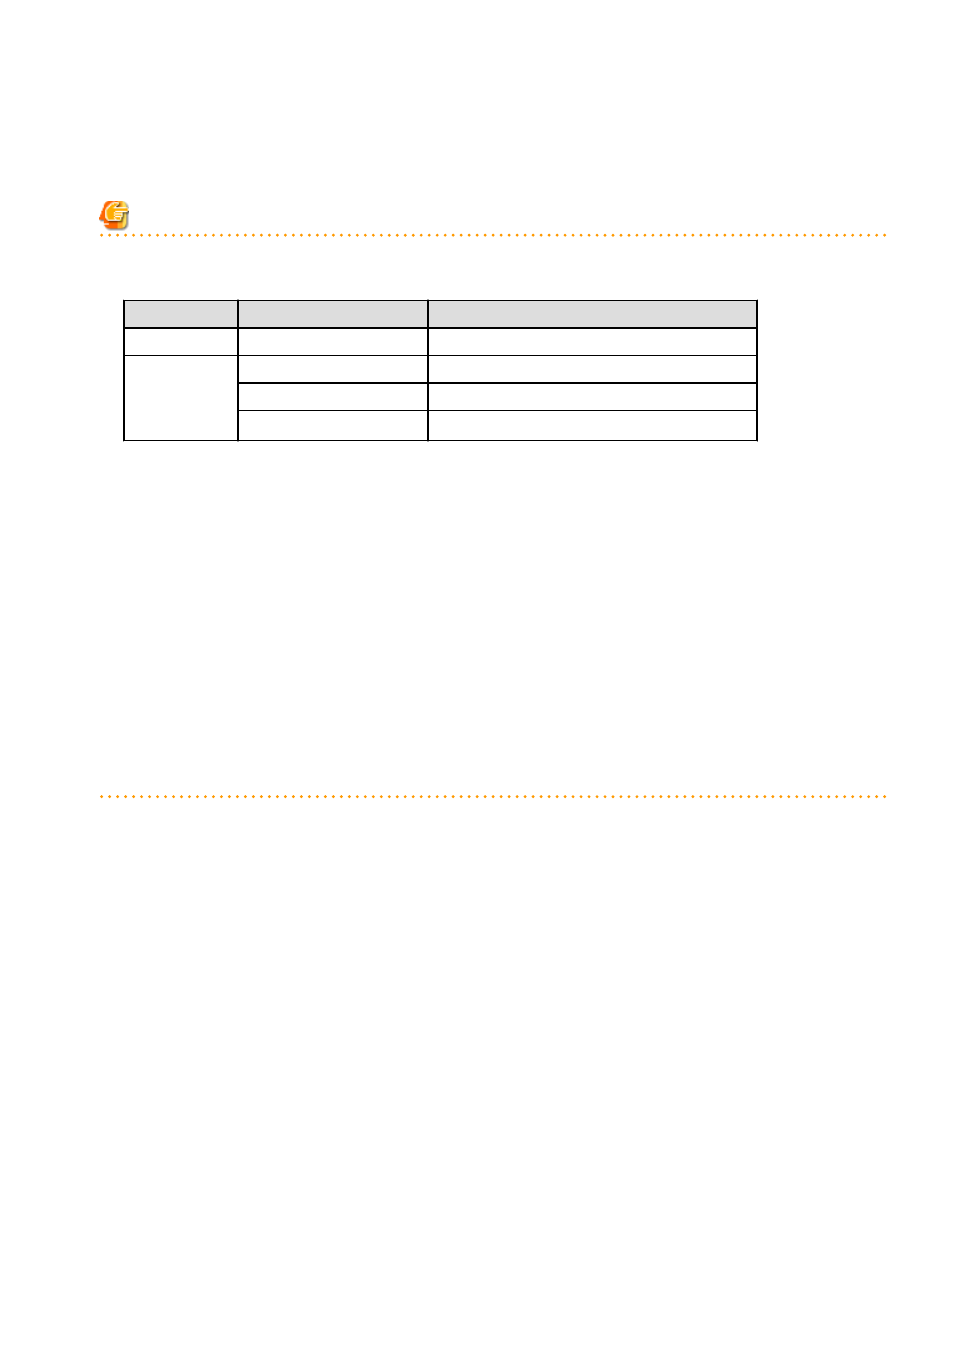
The system conditions data is not reflected in the display until collection at the fixed intervals shown below is completed.
Check the display after the fixed intervals shown below.
Tab name
Display period (*)
Collection time required before displaying
Total
30 days
one whole day (from 0:00 to 23:59)
CPU
Disk
Memory
Network
one hour
ten whole minutes (from 0 minutes to 9 minutes)
one day
one whole hour (from 0 minutes to 59 minutes)
one month/one year
one whole day (from 0:00 to 23:59)
* Note: The display period in each tab except for Total tab can be selected from one hour, one day, one month, or one year.
-
System conditions data is not displayed if the power is off at the monitored L-Server.
-
Proper data collection cannot take place if the VM host to be monitored continuously indicates CPU utilization of 100%. Accordingly,
a display resembling one of the examples below may appear.
Example:
-
CPU utilization rate displays as exceeding 100%.
-
Data cannot be collected, graph does not display.
-
If the virtualization software of the VM host is Hyper-V, network usage of a virtual network is the sum of network usage of the physical
NICs that are registered with the virtual network. Because of this, in a system environment where each physical NIC of a teaming
configuration is registered with virtual networks, each NIC is included for the calculation, therefore network usage is doubly added
up.
-
To provide a viewpoint of hosts, memory usage is displayed as the total memory usage of a host including usage in the VM kernel
and the service console. The memory usage of the system conditions display can be used to check the total memory usage of a host
at that moment.
Display examples for the Total tab and the All tab are shown below.
- 37 -