FUJITSU ServerView Resource Orchestrator Cloud Edition V3.1.0 User Manual
Page 41
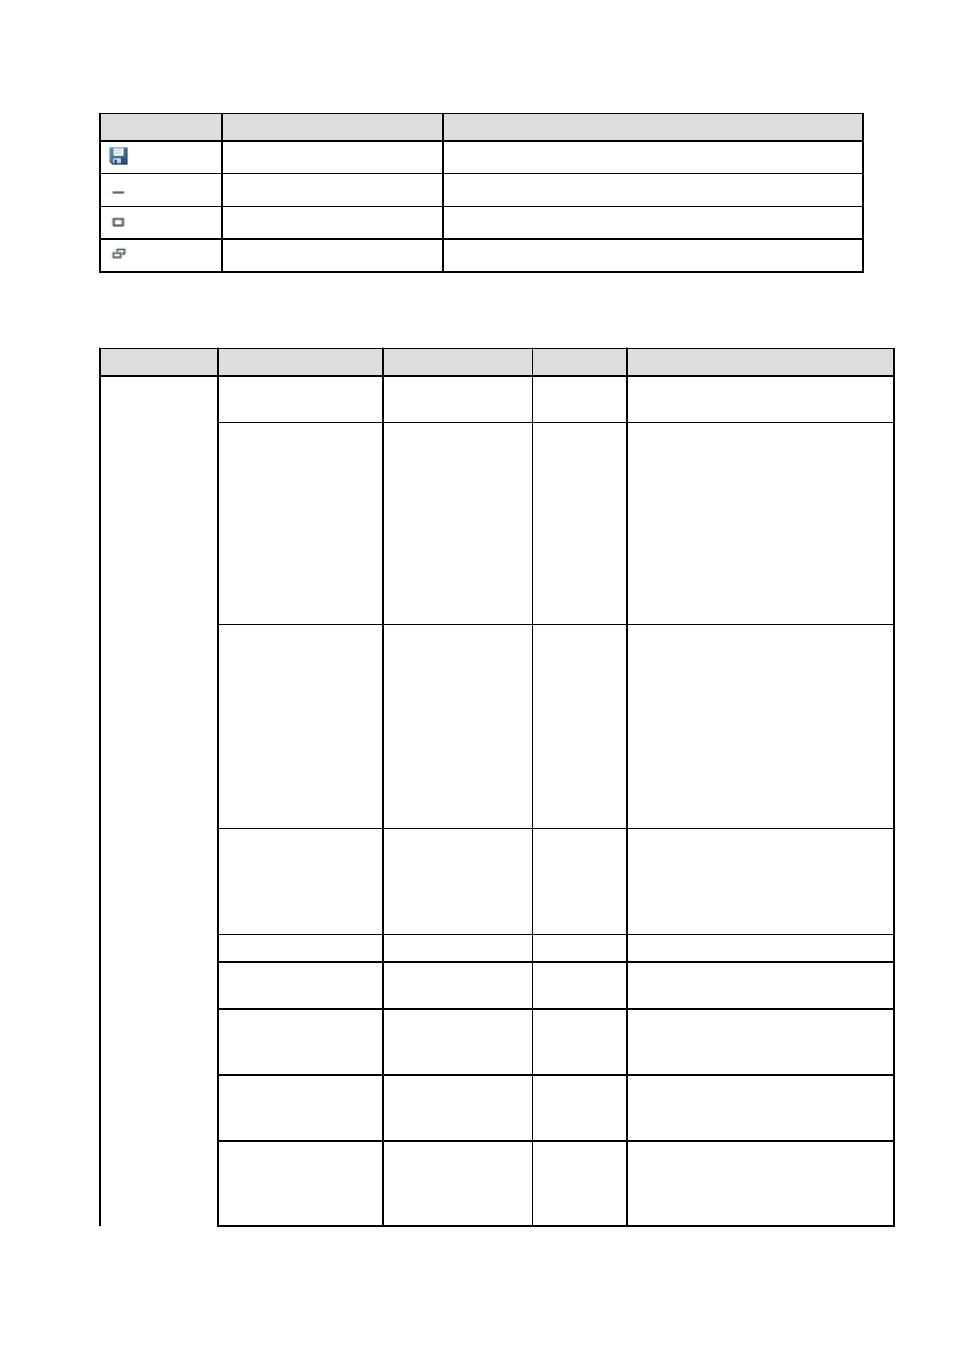
Icon
Tool tip
Explanation
Download CSV file
Downloads the graph data in CSV format
Minimize
Minimizes the specified window
Maximize
Maximizes the specified window
Restore
Restores the maximized window
The table below shows the CSV file items if data is downloaded from each graph.
Note that the CSV file encoding is Shift-JIS.
Graph type
Column name
Explanation
Unit
Description
CPU utilization
sdattim
Collection start time
(*)
yyyy-mm-dd HH:mm:ss
resrcid
Resource ID
-
in case of physical servers and
Windows:
"#" + CPU number or _Total
-
in case of physical servers and Linux/
Solaris:
CPU number or _Total
-
in case of Hyper-V:
VM name + ":Hv VP" + virtual
Processer number
recid
Record ID
Output any of the following
-
WIN_CPUBUSY
-
UX_CPUBUSY
-
VMW_GCPU
-
HV_VCPU
-
XEN_CPU
-
KVM_CPU
consintl
Interval time
second
-
in case of interval time is 10 minutes:
600
-
in case of 1 hour: 3600
-
in case of 24 hour: 86400
coverage
Data coverage
(0 to 1)
cpupcent
CPU utilization
%
Output for physical servers
Processer utilization
vmgcused
CPU utilization
%
Output only for VMware
Physical CPU utilization per virtual
machine
physres
Physical CPU
information or virtual
CPU information
Output only for VMware
ptrtim
CPU utilization
%
Output only for Hyper-V
Utilization of virtual processors allocated to
a virtual machine and consumed by
hypervisor code
- 29 -