FUJITSU ServerView Resource Orchestrator Cloud Edition V3.1.0 User Manual
Page 39
*2: The display interval can be switched to a shorter interval by clicking the data plotting area of a horizontal polyline graph, or switched
to a longer interval by clicking outside the data plotting area.
*3: Disk usage and network usage are not displayed if the virtualization software is Hyper-V, RHEL5-Xen, and Solaris Zones.
*4: The disk R/W count is not displayed if the virtualization software is Hyper-V, RHEL-KVM, and Solaris Zones.
*5: The memory usage is not displayed if the virtualization software is Hyper-V. However, it is displayed if the dynamic memory
setting is enabled.
*6: The network usage is not displayed if the virtualization software is Hyper-V, and Solaris Zones. It is also not displayed if the
physical L-Server is Linux/Solaris.
Note
-
Information obtained from virtualization software is displayed in the system conditions. Virtual Memory usage is not included.
-
The system conditions data is not reflected in the display until collection at the fixed intervals shown below is completed.
Check the display after the fixed intervals shown below.
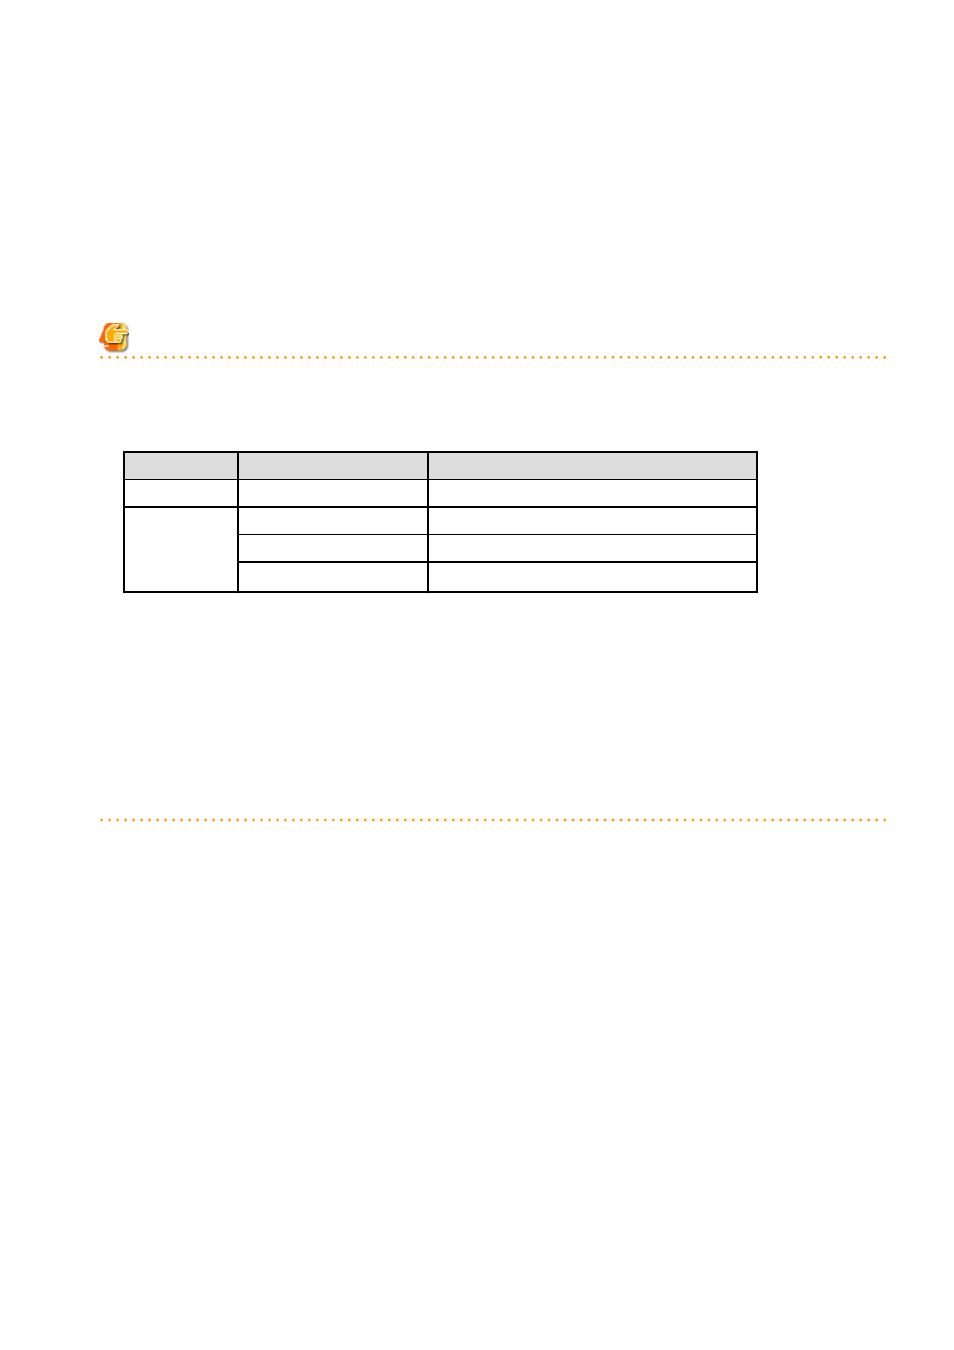
Tab name
Display period (*)
Collection time required before displaying
Total
30 days
one whole day (from 0:00 to 23:59)
CPU
Disk
Memory
Network
one hour
ten whole minutes (from 0 minutes to 9 minutes)
one day
one whole hour (from 0 minutes to 59 minutes)
one month/one year
one whole day (from 0:00 to 23:59)
* Note: The display period in each tab except for Total tab can be selected from one hour, one day, one month, or one year.
-
System conditions data is not displayed if the power is off at the monitored L-Server.
-
If the CPU utilization status continues at 100% at the monitored L-Server, data collection timing may be delayed and an error of about
one second may occur. This may cause CPU utilization (average value for a specified unit of time) to exceed 100%.
Take into account the possibility of data errors when using this display.
Example:
If a monitored L-Server has one CPU and is displayed in units of one hour, the value in the system conditions graphs and CSV file
data may be displayed as 100.03% (60.02 minutes (near equal 3601 seconds)/60 minutes) even though the upper limit for CPU
utilization is 100%.
Display examples for the Total tab and the All tab are shown below.
- 27 -