1 system conditions display – FUJITSU ServerView Resource Orchestrator Cloud Edition V3.1.0 User Manual
Page 48
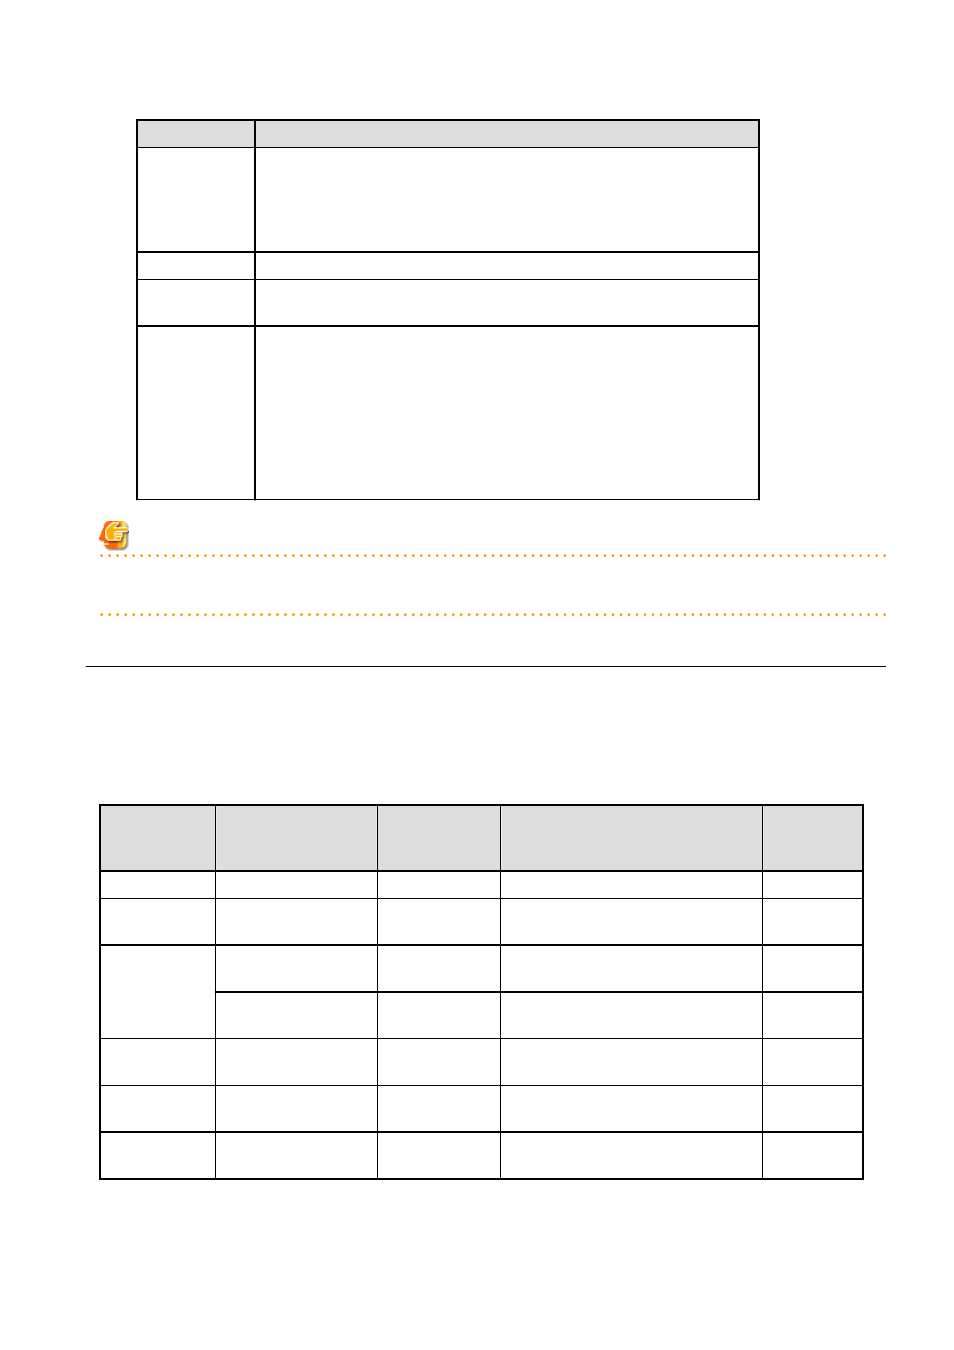
Item
Explanation
VM Host
Displays the VM host name displayed at Resource tab - Trees pain in ROR console
display.
Note that name change is not always reflected immediately in some cases, for example,
when you change the VM host name on the VM Management Software. The change
is usually reflected within five minutes.
IP Address
Displays the IP address of the VM host.
Number of VMs
Displays the number of the running VM guests that was deployed on the VM host in
the L-Platform management page.
VM Type
Displays the type of the VM host.
Example:
-
"VMware": VMware
-
"Hyper-V": Hyper-V
-
"RHEL-KVM": RHEL-KVM
-
"Solaris Containers": Solaris Zones
Note
Clicking the CI list column headers to sort the columns is effective only for the range displayed in that page. The sorting specification is
reset when the next or previous page is displayed. Sorting spanning multiple pages is not available.
5.3.1 System Conditions Display
The system conditions of the VM hosts selected in the system conditions window CI list is displayed as a graph at System Conditions in
the lower part of the window. Up to five VM hosts can be displayed at once in the graphs. If more than five VM hosts are selected, the
first five are displayed.
The system conditions contents can be switched by clicking the System Conditions tabs.
The table below shows the contents under the System Conditions tabs.
Tab name
Display content (*1)
Graph type
Display interval
Display
interval
switching (*2)
Total
Totals for each status
Vertical bar graph
30 minutes, starting from the current time
Not possible
CPU
CPU utilization
Horizontal
polyline graph
One hour/day/month/year from the current
time
Possible
Disk
Disk R/W usage
Horizontal
polyline graph
One hour/day/month/year from the current
time
Possible
Disk R/W count
Horizontal
polyline graph
One hour/day/month/year from the current
time
Possible
Memory
Memory usage
Horizontal
polyline graph
One hour/day/month/year from the current
time
Possible
Network
Network usage (*3)
Horizontal
polyline graph
One hour/day/month/year from the current
time
Possible
All
Overview of all the above
statuses
Horizontal
polyline graph
One hour/day/month/year from the current
time
Possible
*1: Information is displayed using a different color for each L-Server.
- 36 -