FUJITSU ServerView Resource Orchestrator Cloud Edition V3.1.0 User Manual
Page 28
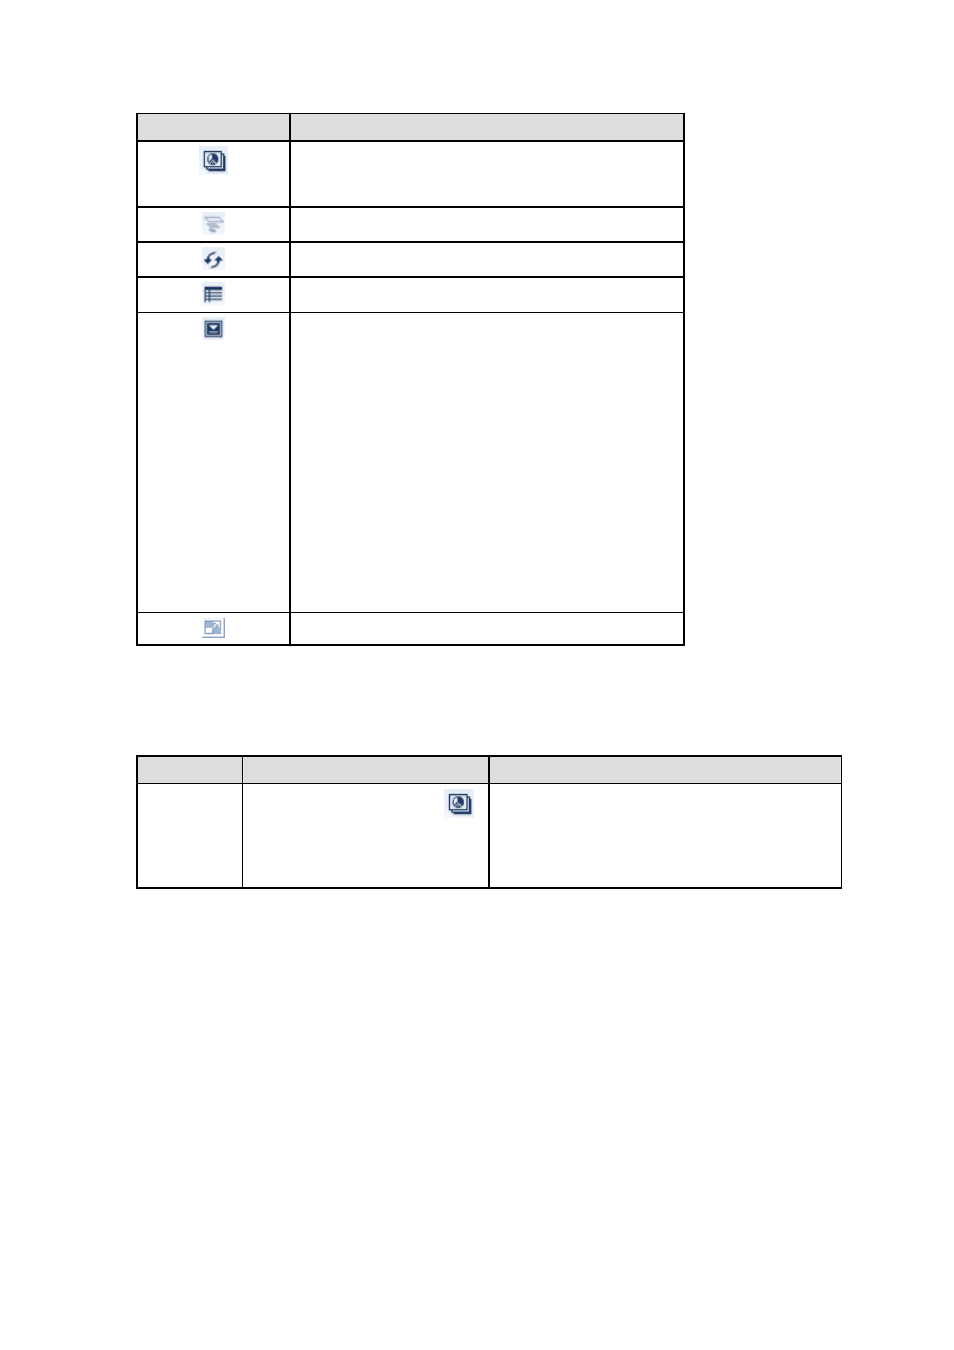
Icon
Explanation
Displays the relationship chart menu
Selects the relationship chart for either "Use state" or "Allocatable
L-Servers".
Switches between the use rate chart and the relationship chart.
Updates the chart with the most recent information
Toggles between table and polyline graph displays
Displays a list of functions
The following functions may be used:
-
Refresh: Updates the chart to the latest information.
-
Change table/graph: Switches between the table and the graph.
-
Drill up: If the relationship chart is displayed, this function
will switch to the use rate chart.
-
Comments: Comments related to charts can be registered.
Related comments can also be referred to.
-
Export CSV: Data from the displayed chart can be output as a
CSV file.
-
Configure: The chart's appearance can be modified
temporarily. Modified content will not be saved.
Enlarges the chart display
2.
Display detailed information in other charts.
If required, display detailed information in other charts.
Refer to "
" for details of the information displayed in other charts.
The table below shows how to display detailed information.
Item
Display method
Contents displayed
Relationship
chart
Click the relationship chart icon (
)
and select the chart to display from the
drop-down menu.
Displays a relationship chart in which the focus is switched
to a display of resource pool absolute values or similar.
The chart displayed varies depending on the resource pool.
For example, the overall amount and used amount are
displayed for the selected resource pool.
- 16 -