FUJITSU ServerView Resource Orchestrator Cloud Edition V3.1.0 User Manual
Page 27
1.
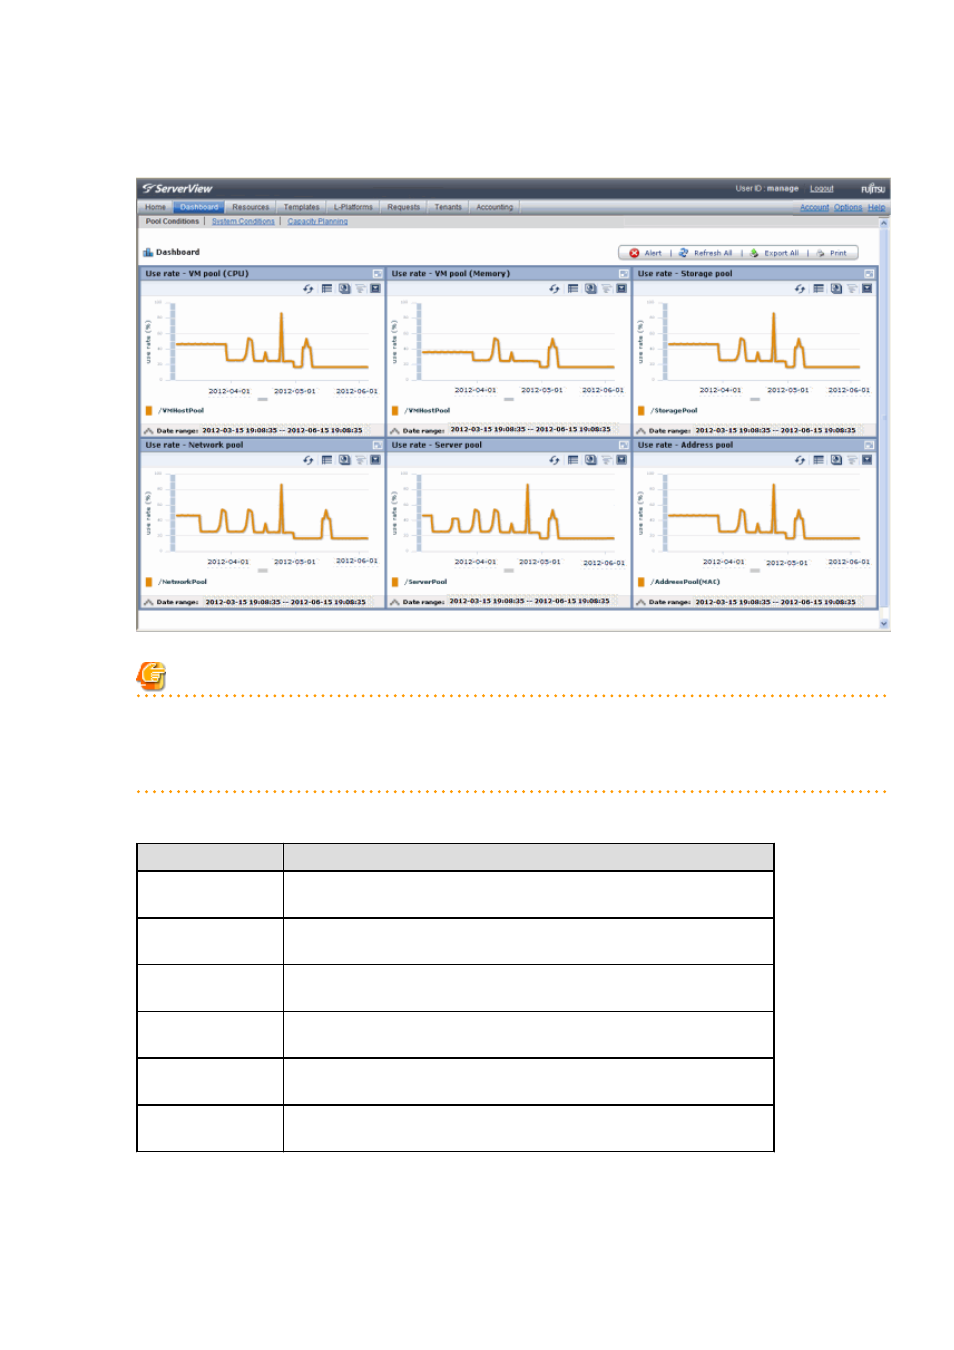
From the ROR console, select the Dashboard tab, then select Pool Conditions in the displayed sub tab.
Charts are displayed for use rate of each resource pool.
Note
Dual-role administrator privileges
Global pool is displayed by default when logging in as the dual-role administrator.
To reference another pool, use the Tenant ID menu at the top right of the window.
The following table lists the six types of charts available.
Chart
Explanation
VM pool (CPU)
Displays the VM pool (CPU) use rate of each pool as polyline graphs. Always
displayed.
VM pool (memory)
Displays the VM pool (memory) use rate of each pool as polyline graphs. Always
displayed.
Storage pool
Displays the storage pool use rate of each pool as polyline graphs. Always
displayed.
Network pool
Displays the network pool use rate of each pool as polyline graphs. Always
displayed.
Server pool
Displays the server pool use rate of each pool as polyline graphs. This is only
displayed if physical servers are registered to the server pool.
Address pool
Displays the address pool use rate of each pool as polyline graphs. This is only
displayed if physical servers are registered to the server pool.
The table below shows the icons displayed in charts.
- 15 -