3 chart display – FUJITSU ServerView Resource Orchestrator Cloud Edition V3.1.0 User Manual
Page 30
4.3 Chart Display
This section explains the charts for each resource pool.
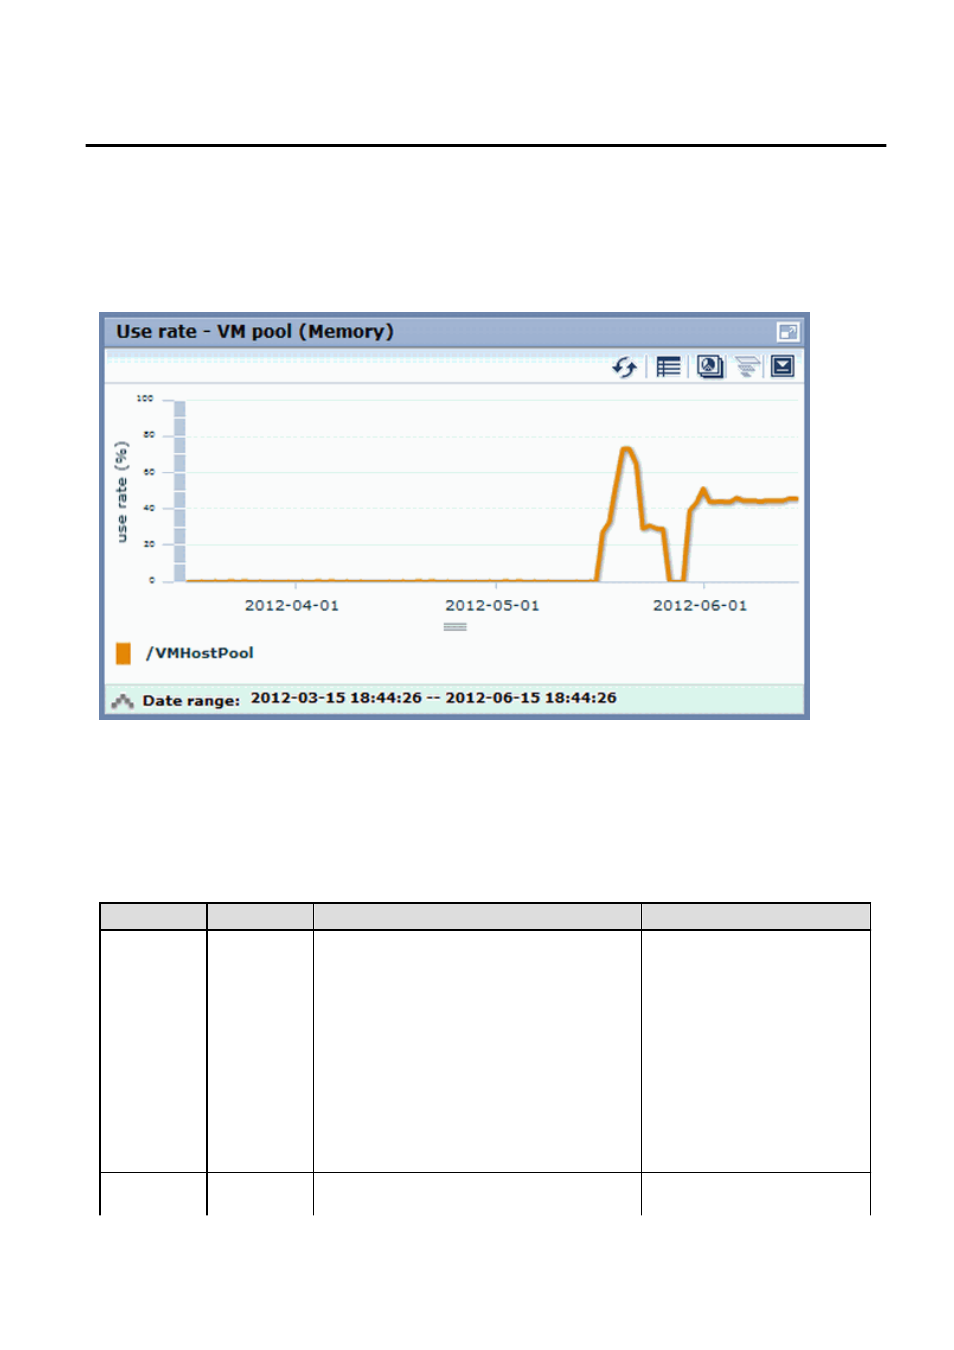
The resource pool charts display resource pool use rates as polyline graphs for each resource pool. If there are multiple resource pools,
the use rates of the display periods of each of the resource pools are added together, and the top five are displayed in order, starting with
the one with the highest total.
The use rate graph displays the daily average. The displayed data will be updated every five minutes.
A VM pool (Memory) window example is shown below.
Detailed information can be displayed in other charts in the resource pool charts.
The data displayed in the detailed information will be updated every five minutes.
The table below shows the detailed information and usage scenarios. Refer to Step 2 under "
method.
The table below shows the other charts.
Display format
Detailed information
Usage scenario
Relationship
chart (Usage
state)
Table
Displays the total amount and the used amount of the
resource pool.
The units are as follows:
-
VM pool (CPU): GHz
-
VM pool (memory): GB
-
Storage pool: GB
-
Network pool: Number of networks
-
Server pool: Number of physical servers
-
Address pool: Number of addresses
Use this chart to check the number
values (absolute values) for the used
amount and number of networks/
servers/addresses.
Relationship
chart
Table
Displays the number of L-Servers that can be deployed
to the resource pool (*2)
If there is insufficient free space or
too few servers, use this chart to
- 18 -