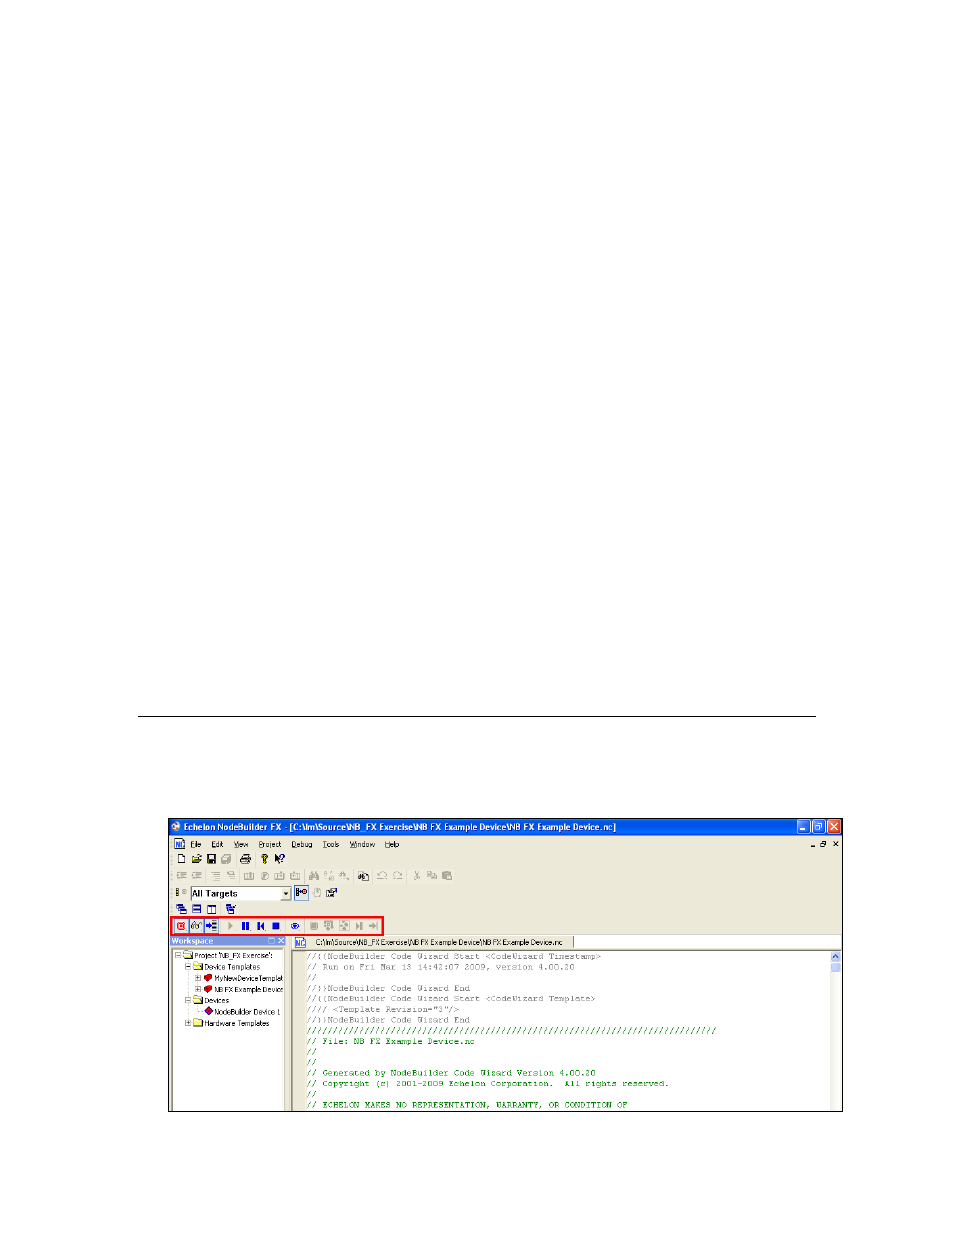
Using the debugger toolbar – Echelon NodeBuilder FX User Manual
Page 258

244
Using the NodeBuilder Debugger
Debug Device
Manager
Displays which devices are currently being debugged, and lets you
pause and resume the application on each device. If at least one debug
session is in progress, the status bar will indicate the device currently
being debugged and its current state (Running, Halted, Reset, and so
on). For more information, see Using the Debug Device Manager later
in this chapter.
Breakpoint List
Displays all the breakpoints that have been set. For more information,
see Setting and Using Breakpoints later in this chapter.
Call Stack
Displays a list of active function calls when the debugger is halted in
application source code. You can this information to trace program
execution logic. For more information, see Using the Call Stack later in
this chapter.
Watch List
Displays all monitored network variables and their values. For more
information, see Using the Watch List Pane later in this chapter.
Except for the Debug Device Manager pane, these panes are docked into the NodeBuilder Project
Manager. The Debug Device Manager pane appears as a floating window by default, but you can
dock it into the NodeBuilder Project Manager by right-clicking it and selecting the Allow
Docking option on the shortcut menu. You can enable a pane to be moved and resized by
right-clicking the pane and clearing the Allow docking option.
Notes: To stop debugging a single device, right-click the device and select Stop Debugging on the
shortcut menu. Alternatively, you can click Debug, point to Stop Debugging, and select Current
Device from the Stop Debugging menu while the appropriate device is displayed in the status bar of
the Debug Device Manager. To stop debugging all devices, click Debug, point to Stop Debugging,
and select All Devices from the Stop Debugging menu.
You can also stop debug devices from the Debug Device Manager pane. To stop debugging for one
device, right-click the device in the Debug Device Manager pane and select Stop on the shortcut menu.
To stop debugging for all devices, right-click one device and select Stop All on the shortcut menu.
If at least one debug session is in progress, the Results pane contains a Debug Log tab, which lists
device errors. You can use this tab to dump trace information while debugging.
Using the Debugger Toolbar
When you start the NodeBuilder debugger, the Debugger toolbar opens. By default, the NodeBuilder
debugger appears directly above the Project pane and below the Window toolbar in the NodeBuilder
Project Manager, but you can move it anywhere.
