Toa M-864D Ver.2.2.0 User Manual
Page 55
55
6. Clear Dynamic Button
Clears the set parameters of all FBS filter points
that have been automatically created when
acoustic feedback was detected in dynamic
mode.
Notes
• Protected filter points are not cleared.
• This button can be operated only while in online
mode.
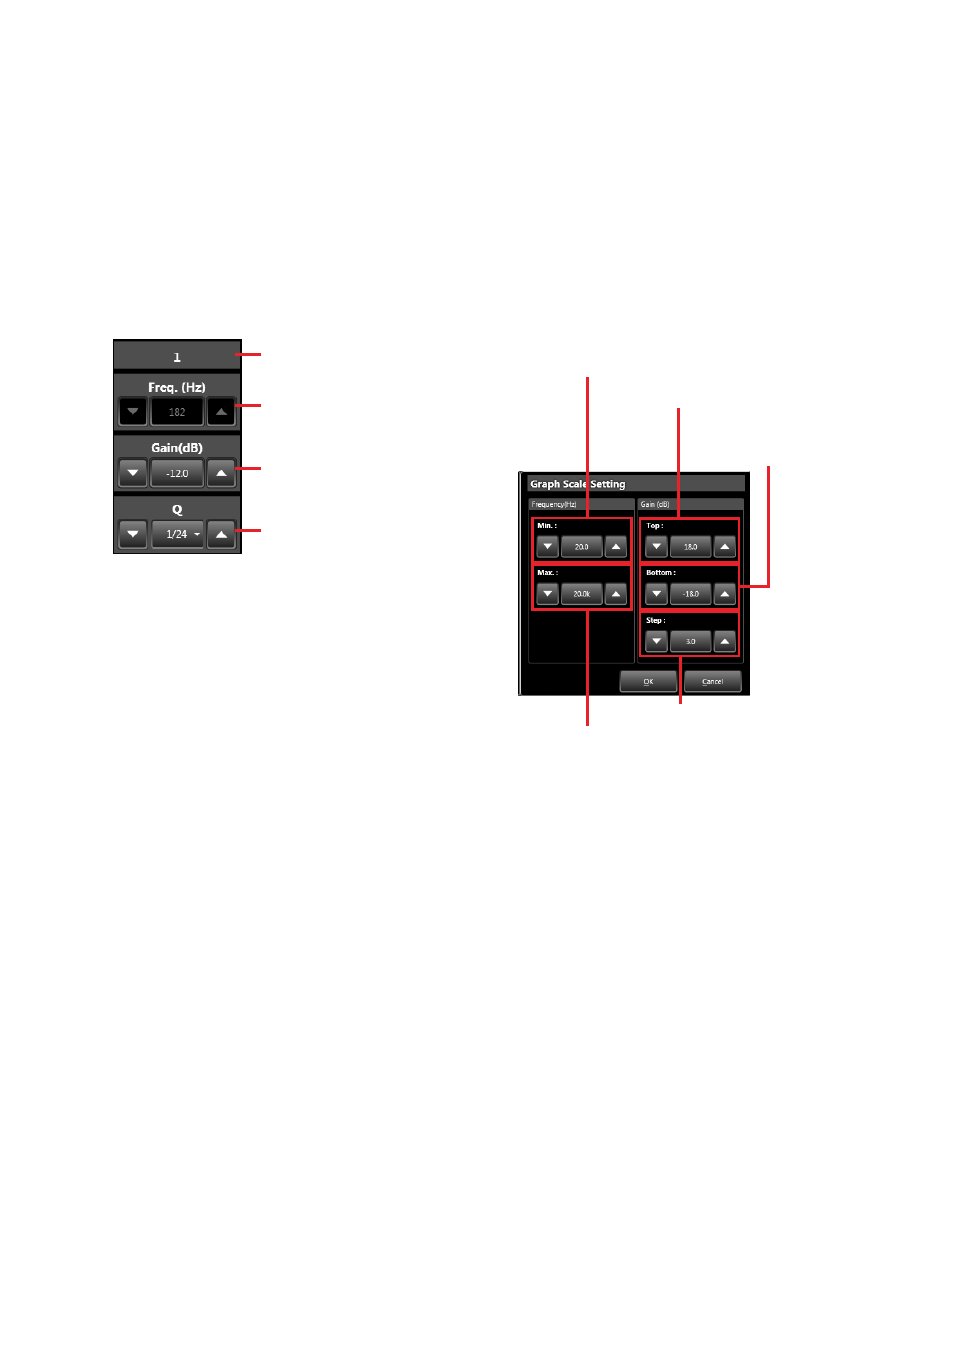
7. filter Point Control
Displays the selected FBS filter point’s
parameters. At the protected point, gains and Q
values can be changed.
Filter No.
Frequency
Gain
Q
Note
The FBS filter’s parameter is automatically set
if the FBS function is set to ON. Parameters of
unprotected points cannot be changed.
8. filter Point Guard Button
Sets the guard function for the selected FBS filter
point.
The indication is displayed in yellow if “Yes” is
selected, and in gray if “No” is selected.
Notes
• For the FBS filter set to “Yes,” the filter
parameter is not updated even if the dynamic
FBS function has been set to ON with the
Dynamic Mode button. Select “Yes” when not
wishing to change the filter parameter because,
for example, it is desirable to fix the frequency
for feedback suppression.
• For the FBS filter set to “No,” the filter parameter
may be changed when feedback is newly
detected. Gains and Q values can be changed
for the guarded filter point.
9. Lock Button
Used to enable or disable the locking of gains
when dragging filter points.
Clicking “Gain Unlock” changes the indication,
locking the gain.
If the gain is locked, it becomes unchangeable
even if the filter point is dragged up and down.
Clicking the same button again restores the
previous display and releases the lock.
Note
Gains can only be locked for the filter point
operation. The gain control can be used to change
settings even while in locked mode.
10. Graph/table Display Selector Button
Switches the display of the filter control field.
“Graph”: The button is displayed in gray and
the filter control field is placed in graph
display mode.
“Table”: The button is displayed in orange and
the filter control field is placed in table
display mode.
11. Scale Setting Button
Clicking this button while the filter control field
is in graph display mode displays the dialog for
setting the graph’s scale.
E. Step settings
A. Minimum frequency settings
C. Maximum amplitude
settings
D. Minimum amplitude
settings
B. Maximum frequency settings
a. Minimum frequency Settings
Sets the minimum frequency for the graph
display (i.e. sets the left edge of the graph).
The downward pointing triangle button
decreases the frequency and the upward
pointing triangle button increases the
frequency.
Clicking the frequency indication in the center
opens the dialog for frequency entry.
B. Maximum frequency Settings
Sets the maximum frequency for the graph
display (i.e. sets the right edge of the graph).
The downward pointing triangle button
decreases the frequency and the upward
pointing triangle button increases the frequency.
Clicking the frequency indication in the center
opens the dialog for frequency entry.
C. Maximum amplitude Settings
Sets the maximum amplitude for the graph
display (i.e. sets the upper limit of the graph).
The downward pointing triangle button
decreases the amplitude and the upward
pointing triangle button increases the amplitude.
The amplitude varies by the value set in the