5 gathering and displaying system environment data, 4 services monitored by nagios – HP Insight Control Software for Linux User Manual
Page 171

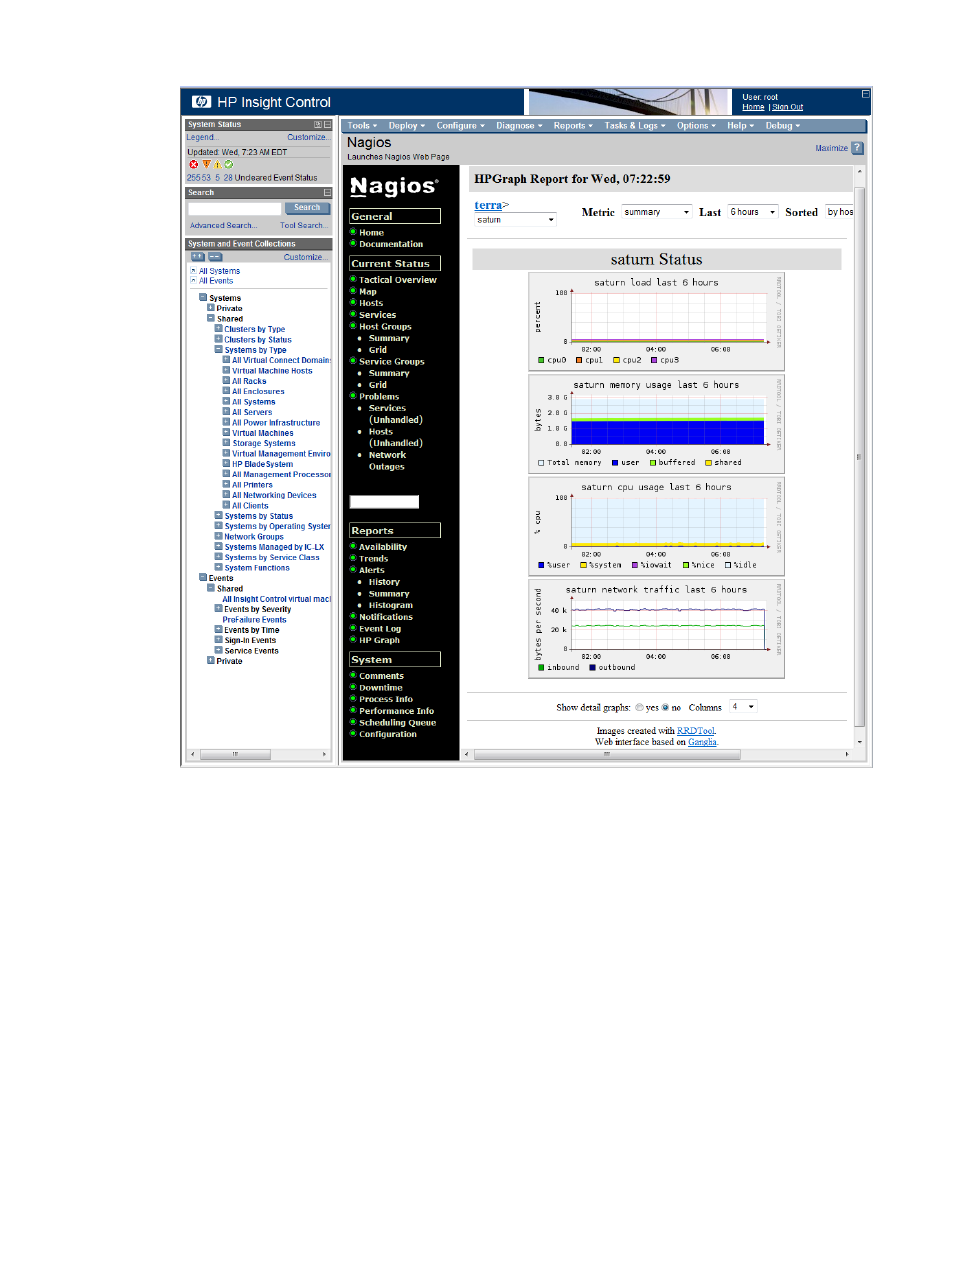
Figure 32 HP Graph host display for one managed system
20.3.5 Gathering and displaying system environment data
Insight Control for Linux provides plug-ins that monitor the environment data on each managed
system such as temperature and fan speed, which can be indicators of possible system failure.
To display environment data, select the Service Problems menu item in the left frame of the Nagios
main window to open the Service Status for All Hosts window.
You can also use the shownode metrics sensors command to display environmental data.
See
for more information.
20.4 Services monitored by Nagios
Services, also referred to as plug-ins, typically gather information for many managed systems at
a time and apply the information to Nagios through the Nagios FIFO (passive checks) on a managed
system basis.
Nagios plug-ins are located in the /opt/hptc/nagios/libexec directory on the CMS.
lists each Nagios plug-in service that runs on the CMS. The items in the Service Name
column correspond to the Service column of the Nagios Service Detail View and Service Problems
View windows, which are shown in
and
, respectively.
20.4 Services monitored by Nagios
171
