Main menu “version, Chart and chartdesigner – Ocean Optics NanoCalc User Manual
Page 55
Ocean Optics Germany GmbH Thin Film Metrology
54
7.5
Main menu “Version”
This menu is visible only if you own a “combiversion” = a combined version of NanoCalc and ElliCalc. You
may switch to the other application
7.6
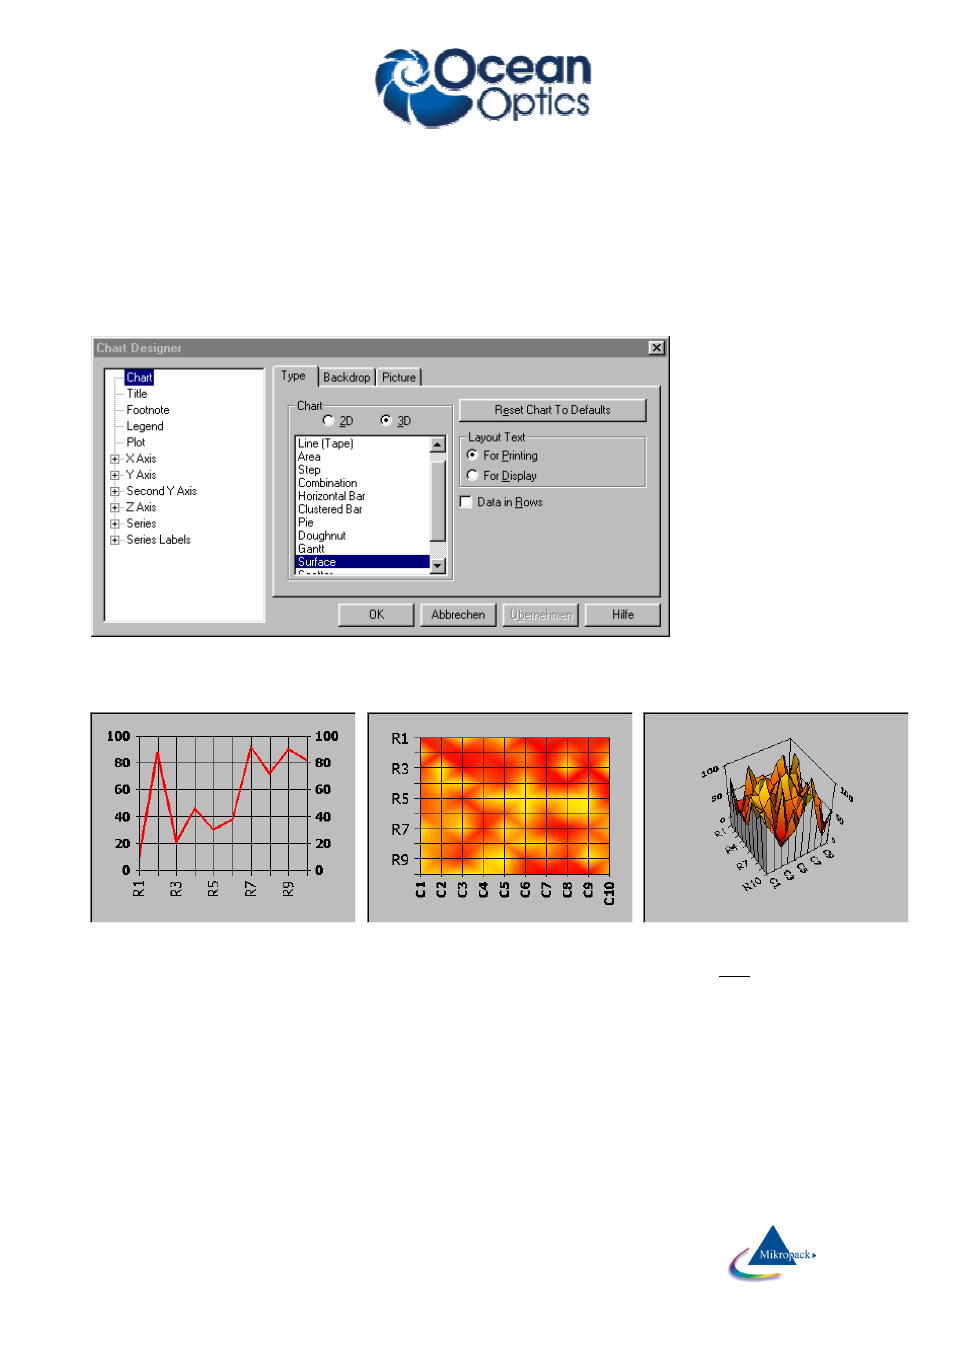
Chart and chartdesigner
If you produced a 1D-
plot or 2Dplot or 3Dplot
you may change nearly
ALL parameters of the
plot by clicking with the
RIGHT mouse button
Hint:
To change the view
position: keep CTRL
button pressed and
move the mouse at the
same time.
For further information see VCFI5.hlp in the help directory of your NanoCalc installation.
1D-plot
2D-plot
3D-plot
During mapping it is possible to produce 1D-plots, 2D-plots and 3D-plots.
These plot types can be changed interactively after the mapping was finished. Click with right mouse button
on the plot to get access to the "chart designer“.
- Apex 785 Raman (1 page)
- STS-UV (2 pages)
- TR2 Engineering Note (4 pages)
- SAD500 Communications and Control (19 pages)
- Red Tide USB650 Install (26 pages)
- Fiber Optic Termination Kit (6 pages)
- Transmissive pH Probe (10 pages)
- Remora (42 pages)
- PlasCalc (59 pages)
- Correcting Device Driver Issues (8 pages)
- ecoVis Krypton Light Source (16 pages)
- LPC-500CM (28 pages)
- HPX-2000 (24 pages)
- ADC1000-USB (27 pages)
- Torus Operating Instructions (30 pages)
- ADC2000-PCI (13 pages)
- Sensors for Real-Time Analysis (2 pages)
- IDRaman reader (2 pages)
- DH-2000-CAL (30 pages)
- QE65 Pro (32 pages)
- Collimating Lenses (2 pages)
- D1000 (2 pages)
- IDRaman mini (2 pages)
- HR2000CG-UV-NIR (42 pages)
- Cool Red (1 page)
- HL-2000 (20 pages)
- XE-1 Xenon (6 pages)
- USB-ADP Serial Adapters (3 pages)
- CHEM2000 (36 pages)
- Deuterium-Halogen Calibration Light Source (19 pages)
- NeoFox Engineering Note (30 pages)
- QE Pro (2 pages)
- OOIBase32 (140 pages)
- AR-1 Argon (6 pages)
- pH Sensor Patches, Probes and Cuvettes (36 pages)
- SpecLine Offline Spectroscopy (60 pages)
- HL-2000-HP-232 (26 pages)
- External Triggering Options Instructions for Spectrometers with Firmware Version 3.0 and Above (16 pages)
- Breakout Box (10 pages)
- USB-ISS-UV_VIS (4 pages)
- ISS-UV_VIS (6 pages)
- OOIColor (14 pages)
- LS-1 Series (12 pages)
- Apex Install (24 pages)
- DH-2000 (34 pages)