Ocean Optics NanoCalc User Manual
Page 27
Ocean Optics Germany GmbH Thin Film Metrology
26
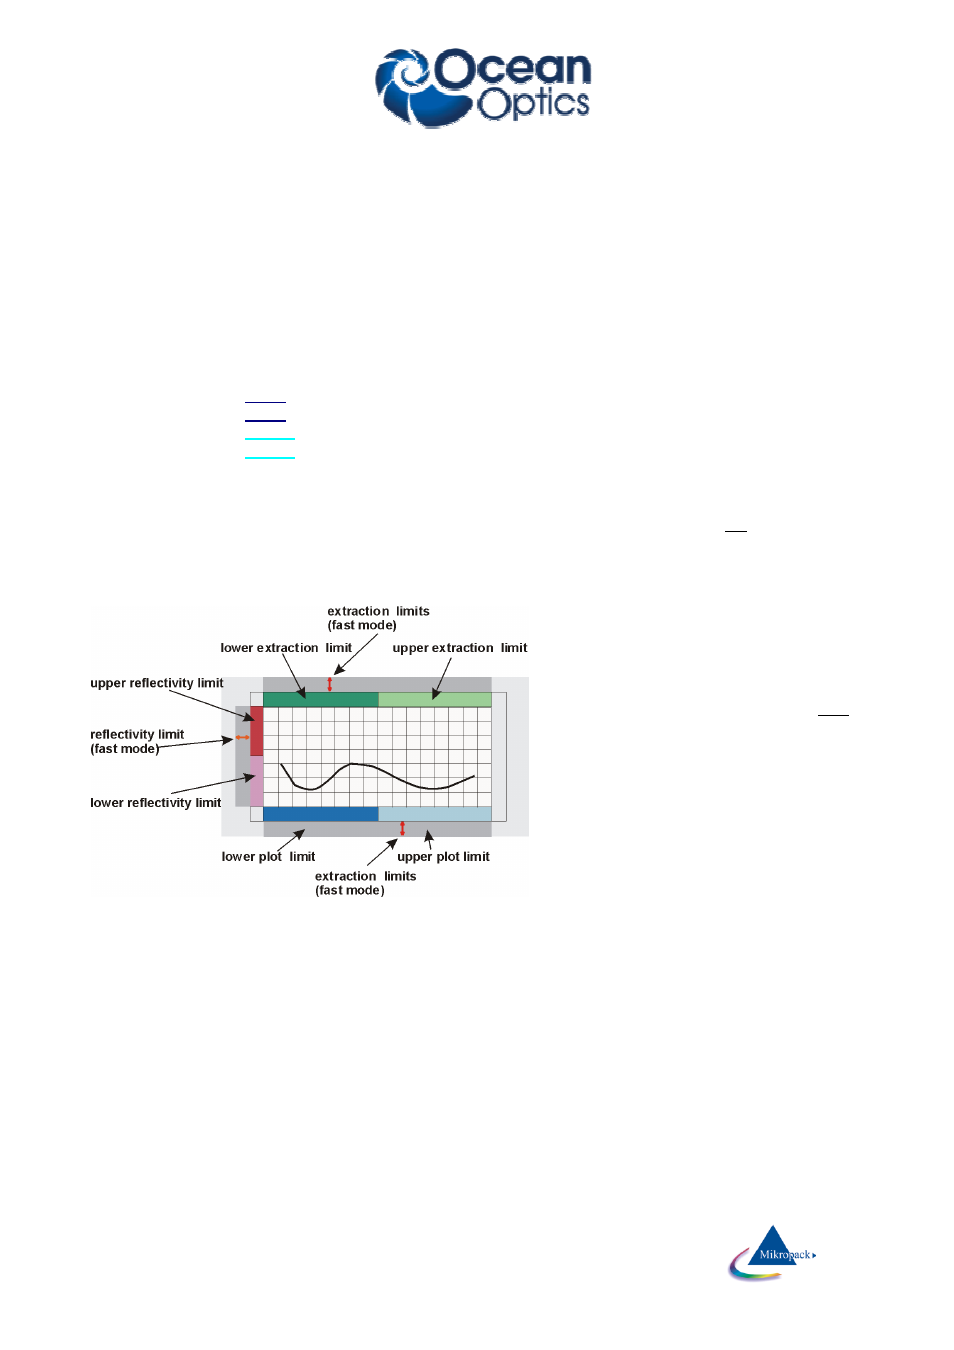
7.2.3.1 Plot limits
The plot limits are the left and right side of the plot on your screen and coincide with limits of measurement.
The adjustable values of the plot limits depend on the grating in your Ocean Optics Spectrometer and are
noted in the calibration sheet of your system.
The plot limits may be changed within NanoCalc in steps of 1 nm.
1. normal mode to change the limits:
open the menu “spectrometer data \ limits” and enter numbers or use the up-down arrows
2. fast and rough method to change the limits:
If you click in the field near the
LOWER
numbers you may change the plot limits without entering the
menu option/limits:
If you click in the
LEFT
half with your LEFT mouse button you will decrease the lower plot limit.
If you click in the
LEFT
half with your RIGHT mouse button you will increase the lower plot limit.
If you click in the
RIGHT
half with your LEFT mouse button you will decrease the lower plot limit.
If you click in the
RIGHT
half with your RIGHT mouse button you will increase the lower plot limit.
The same feature applies to plot limits and reflectivity limits.
3. fast and precise method to change the limits:
If you move your mouse very near to the lower part of the plot window (but still in the grey part) you will
see a little vertical arrow and the value of the wavelength is displayed. If you now click with the left mouse
button, you are able to change the lower plot limit (right mouse button=upper plot limit). The same applies
to the other 2 grey zones = extraction and reflectivity limits (see picture)
4. Zoom
You may zoom by
dragging the mouse from
one point to another
within the plot area.
If you click with the right
mouse button a small
popup window will appear
with the chance to undo
this zoom.
You can also change the
plot limits back to the full
range (according to your
spectrometer limitations).
You can also set the
current plot limits as a
standard or return to a
previously set standard.
ATTENTION:
To be consistent with data handling, ALL materials files contain n and k data between 150 nm and 1100
nm. Usually only parts of these data are measured data (e.g. between 206 nm and 840 nm or between
300 nm and 1100 nm). If you simulate, the valid part of the curve is shown in black while the rest is shown
in grey (and you get a message).
Extraction limits are restricted to the range of valid n and k data.