Ocean Optics NanoCalc User Manual
Page 29
Ocean Optics Germany GmbH Thin Film Metrology
28
•
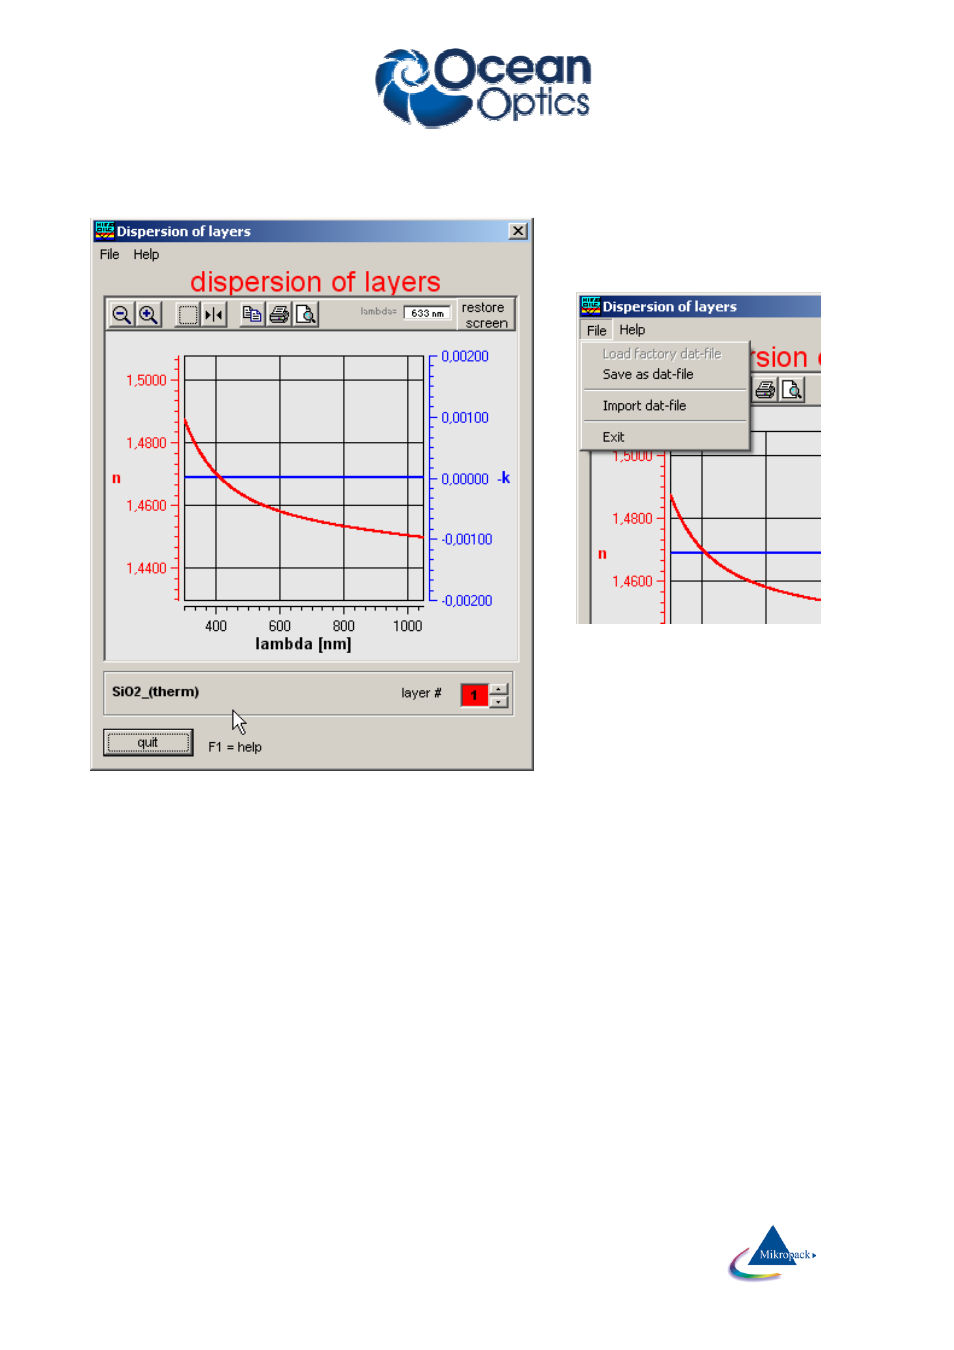
You may use 2 cursors (symbol #4). At start time of the cursors both cursors are painted on top of
one another, move them with the mouse. The cursor values are shown in blue (= k(λ)) and red (=n(λ))
•
You may also zoom in and out and in an area (symbols #1 - #3)
You may also save these dispersion values
as a dat-file, but be very careful about the
target directory !!
ATTENTION:
To be consistent with data handling, ALL materials files contain n and k data between 150 nm and 1100 nm.
Usually only parts of these data are measured data (e.g. between 206 nm and 840 nm or between 300 nm
and 1100 nm).
If you simulate, the valid part of the curve is shown in black while the rest is shown in grey (and you get a
message).
Extraction limits are restricted to the range of valid n and k data.
7.2.5
Pixel resolution
This option is only useful for very thick films. If you use the option pixel resolution the software will acquire
and display all data in spectrometer pixels and no more in nanometer resolution.
With pixel resolution data are displayed at exactly those wavelengths where there is a pixel in your
spectrometer. If you own a high resolution spectrometer there is a spectral resolution down to 0.2 nanometer
or less. For more precise information consult your hardware supplier.
The same option is also accessible via menu “data extraction \ sampling”.