Ocean Optics NanoCalc User Manual
Page 50
Ocean Optics Germany GmbH Thin Film Metrology
49
Roughness is quite common for thick layers like 20 micrometers of photoresist, as the drying process is very
critical and the shrinking of the resist does not lead to perfect surfaces.
Roughness is also quite common for technical surfaces like aluminum or brass or steel that are to be
covered with protection layers (like DLC = diamond like carbon layers).
Methods:
In NanoCalc an empirical methods is implemented to deal with roughness:
1. no roughness
No roughness is included in the calculation.
2. constant roughness
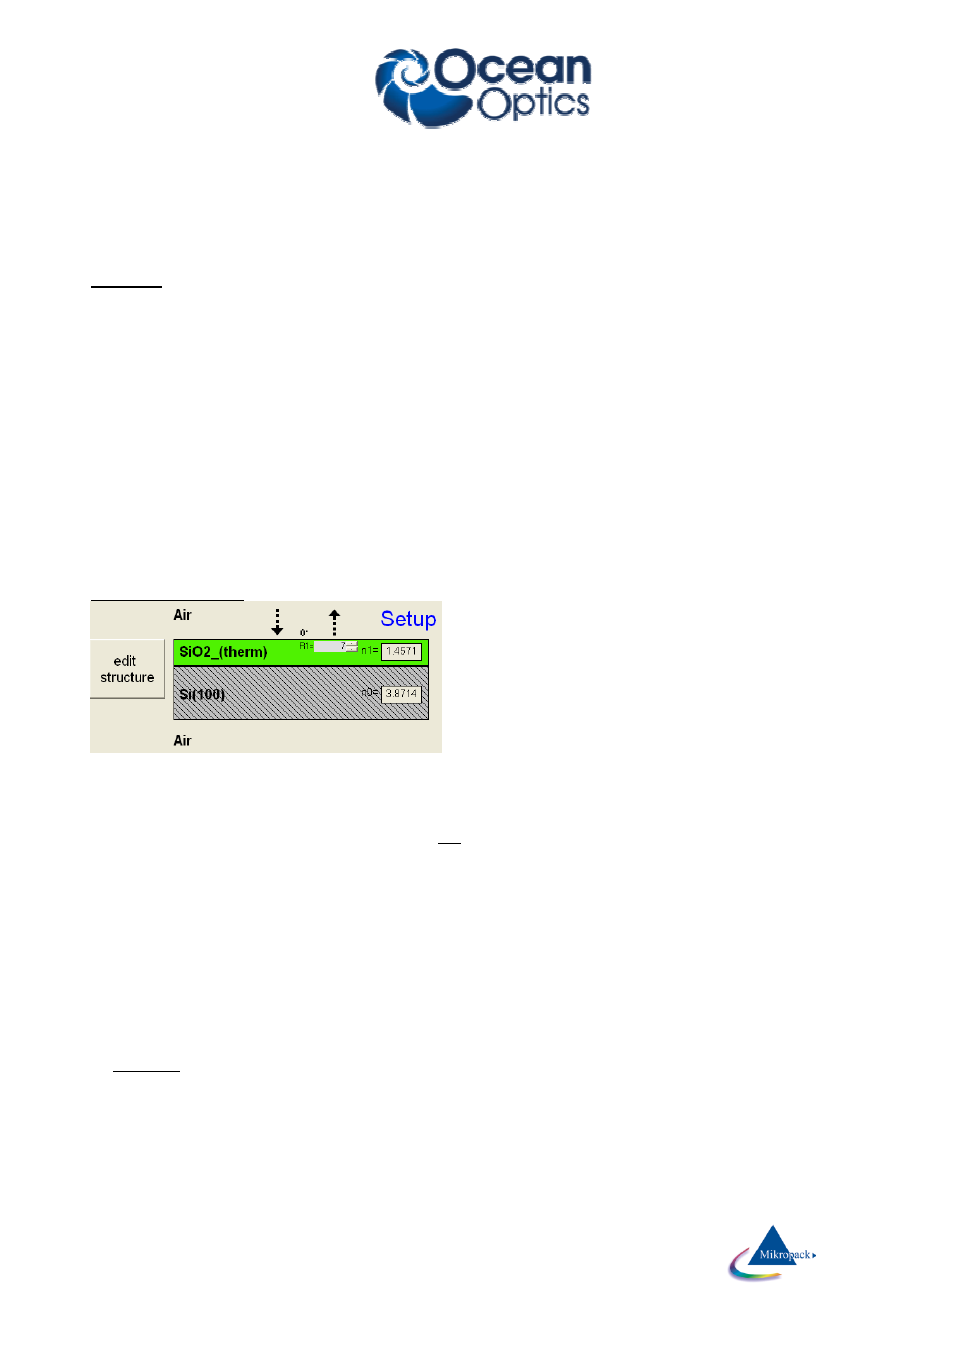
You will see some textboxes in the setup area which show “R-factors” for each interface. This value
means a percentage of light that is regarded as lost at this interface. So there is no real physical
roughness model. Such a physical model cannot be given as the typical size of the roughness is
absolutely unknown. This means that even the scattering mechanism (Mie scattering, Rayleigh scattering
etc) is unknown. There are some formulae in the literature but in our case these are not better than the
above mentioned method of light loss via some empirical R-Factors.
An R-factor of R=0 means a perfect surface = no roughness
An R-factor of R=50 means a loss of 50% light at this interface.
There is no wavelength dependency of these empirical factors.
In the current version there is no wavelength dependency of these empirical factors.
constant roughness
You may input roughness values in the roughness textboxes or use the slider in the roughness window.
Method:
At each interface a certain amount of light is regarded as lost. This percentage has to be input via roughness
textboxes in the setup area. These R-factors are not dependent on wavelength.
This algorithm does NOT manipulate measured data, but the measured amplitude might still differ
considerably from the simulated amplitudes. This means that the fit procedure might still have problems to
find a good solution.
Try menu “Special modes” instead.
7.5.3
Special modes
Please be aware of the fact that all actions within this menu are real manipulations of your measured data !
You change data to get better results, this maybe risky…
1. apply formula
It is possible to apply many reasonable formulae to the spectrum.
Example:
Spectrum=Spectrum*0.9
(all values are multiplied with a constant factor 0.9)
You may also try:
Spectrum=Spectrum*(1+lambda/800)
and many others …