Ocean Optics NanoCalc User Manual
Page 41
Ocean Optics Germany GmbH Thin Film Metrology
40
6. To set the next data point, click on the up down counter (now it should show the value 2 instead of 1)
and then move to the measuring position as before
7. Save the new recipe (like test.mrc) with the extension .mrc
7.4.2
Result List
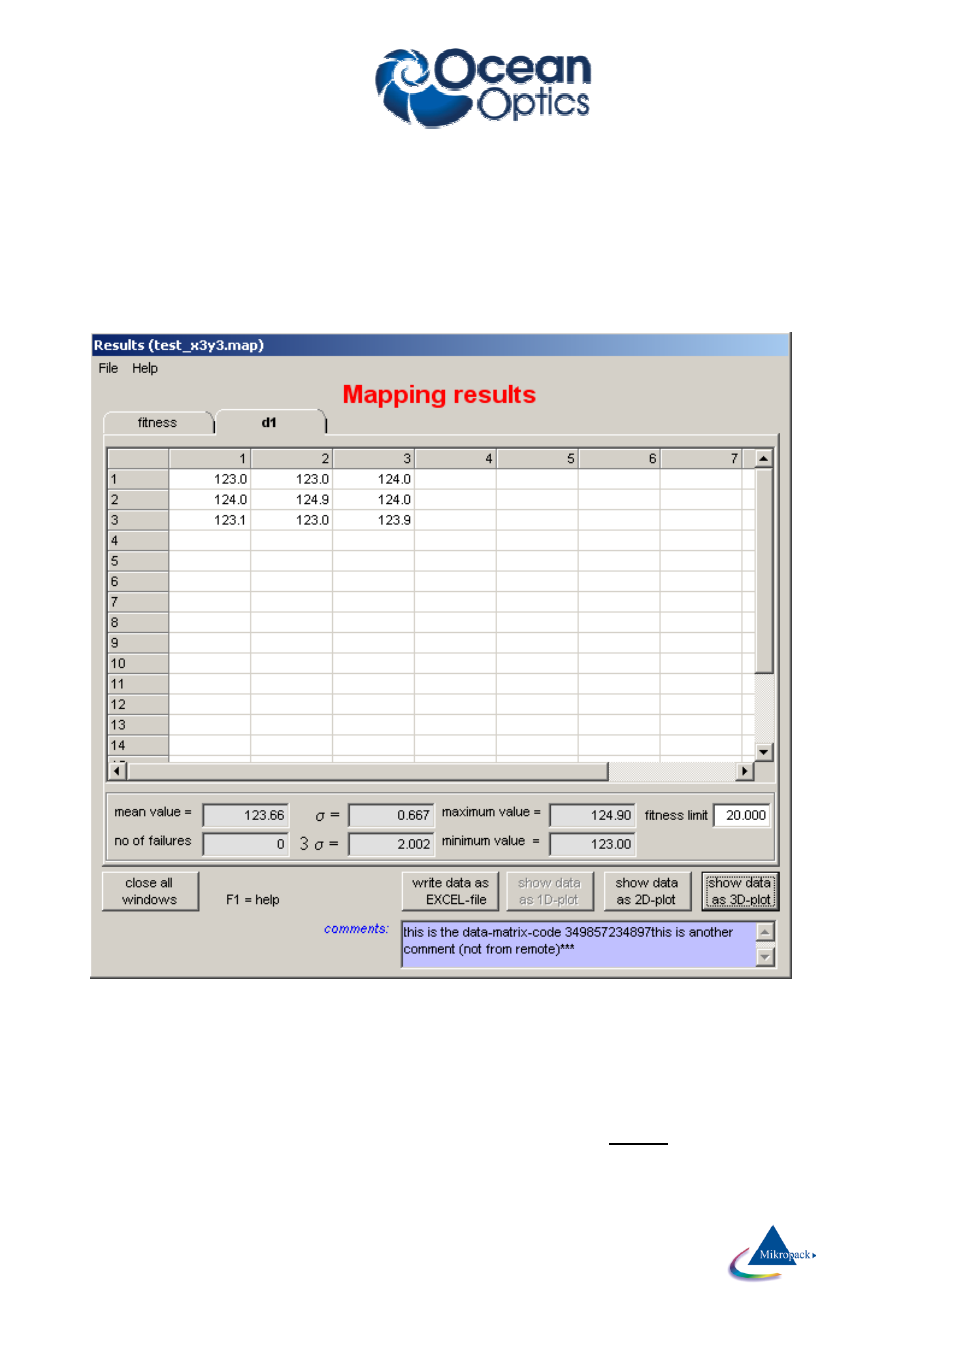
As soon as the mapping is finished you will see a result list:
On the first page you see the measured thickness values for each layer. In the picture above there was just
one layer and 3 x 3 = 9 measured data points. In the last page you can see the associated fitness values for
each coordinate. In the text windows below the data window you see mean values, maximum and minimum
values and standard deviation σ, the 3σ-value and the number of failures (according to the measured fitness
and your fitness limit).
If you did not choose a regular scan pattern, you will see a one-dimensional list.
If you click on the buttons with the numbers in a row or a column you will highlight a certain number of data
points (in the picture above column 3 was highlighted). Now you can control these selected values in a one-