Interpreting the testprint, Interpreting the test print -10, Interpreting the test print – Xerox DocuPrint NC60 User Manual
Page 144
Adjusting Density and Color Balance
4-10
❖
DocuPrint NC60 System Administrator Guide
Interpreting the
Test Print
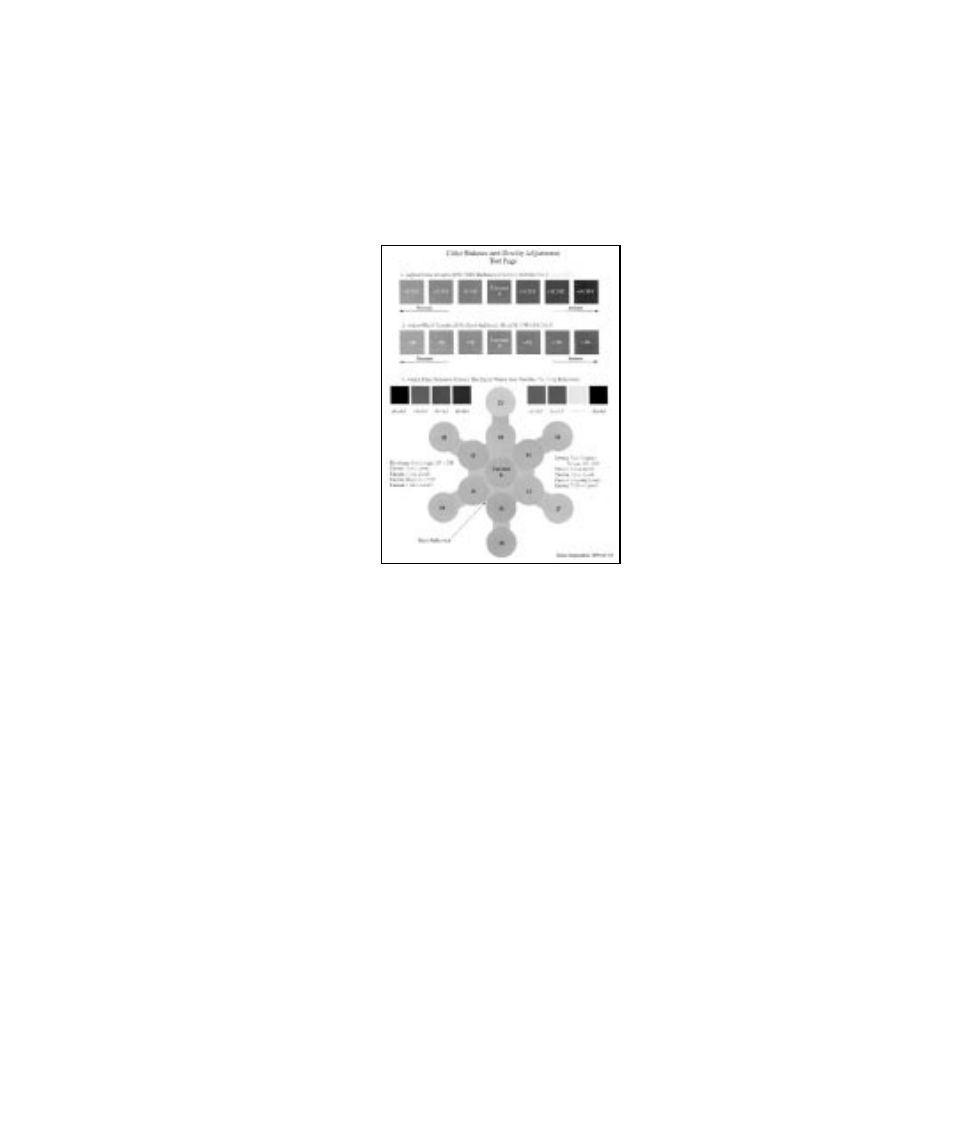
The Color Balance test print contains numbered images
that indicate possible adjustments that can be made, as
shown in Figure 4.2. You can choose to make an
adjustment to the Color Density, the Black Density, or the
Color Balance.
(While Figure 4.2 is in black and white, the actual Color
Balance test page is in full color.)
The Color Density Images, numbered -3CMY...0,...+3CMY
and the current setting show a lightness/darkness range of
three color gray 30% halftones.
The Black Density Images, numbered -3K...0,...+3K and
the current setting show a lightness/darkness range of
black only 30% halftones.
The Color Balance Images, numbered 0,10,11,...21 and
the current setting, show variations of three color gray.
Each of these circles contains gray with tints of other
colors.
Figure 4.2 Color Balance Test Print
- 3040 (2 pages)
- Phaser 7750 (5 pages)
- Phaser 7750 (2 pages)
- 6350 (4 pages)
- Phaser 6180 (4 pages)
- Phaser 3600 (2 pages)
- Phaser 3435 (98 pages)
- ColorQube 9202 (16 pages)
- ColorQube 9203 (13 pages)
- DocuColor 242-252-260 con Creo Spire CX260-17131 (216 pages)
- DocuColor 8000AP (4 pages)
- DocuColor 8000AP (13 pages)
- DocuPrint M760 (44 pages)
- Phaser 860 (42 pages)
- Phaser 3450 (58 pages)
- Phaser 3635MFP (10 pages)
- Phaser 5500 (5 pages)
- Phaser 6100 (7 pages)
- Phaser 7300 (28 pages)
- WorkCentre Pro 215 (62 pages)
- Color Printer Phaser 7300 (3 pages)
- Phaser Color Printer 7750 (8 pages)
- 4127 (4 pages)
- 480 (352 pages)
- 3R11474 (2 pages)
- 4500 (3 pages)
- 721P85600 (116 pages)
- 721P (2 pages)
- WorkCentre XE80 Digitaler Kopierer - Laserdrucker-9588 (58 pages)
- FreeFlow DST2-NL (23 pages)
- FaxCentre F12 (4 pages)
- 4182 (39 pages)
- Copycentre C175 (2 pages)
- ColorStix 8200 Ink Sticks 016-2045-00 (9 pages)
- DocuColor CX250 (276 pages)
- HP Toner Cartridges C9722A (2 pages)
- DocuColor 40CP (82 pages)
- 4850 (90 pages)
- Phaser 016-1300-00 (2 pages)
- X2 (41 pages)
- M123 (12 pages)
- 6130N (3 pages)
- WorkCentre PE120-120i-3133 (20 pages)
- 7300 (4 pages)
- Color Printer Phaser 6280 (158 pages)