Checkline TI-CMXDLP User Manual
Page 44
– 44 –
H. Coating Thickness Value – Displays the actual thickness of any coating adhered to
a metallic material surface (PECT Mode), or a coating adhered to a non-metallic
surface (CT Mode).
I. Minimum Material Thickness – Part of the Alarm feature. Displays the minimum
thickness value found during a scan.
J. Maximum Material Thickness – Part of the Scan feature. Displays the maximum
thickness value found during a scan.
K. B-Scan Display – Cross section view of the material. Provides the user with
graphical view of the opposite/blind surface (i.e. inside pipe wall surface), to give
the user some idea of the condition, or integrity of the material being tested.
Rectified (RECT) A-Scan
The RF mode shows the waveform in a similar fashion to an oscilloscope. It shows both
the positive and the negative peaks. The peak (either positive or negative)selected for
measurement is shown in upper portion of the display.
It’s important to note that a measurement must
fall inside the displays viewable range in order
to see the waveform. However, even if the
waveform is outside of the viewable range of
the display, a measurement can be taken and
viewed on the digital readout. If the wave is
outside of the display range, you can manually
change the range by adjusting the Delay
and Width values, or you can use the Auto
Find feature located in the UTIL menu of
the tabbed menu items. Refer to section 10.1
for additional information on the Auto Find
feature. The following is a list of the viewable
features on the display:
A. Repeatability/Stability Indicator – This indicator should be commonly used
in conjunction with the digital thickness values displayed. When all the vertical
bars are fully illuminated and the last digit on the digital thickness value is stable,
the TI-CMXDLP is reliably measuring the same value 3 to 200 times per second,
depending on which measurement mode and features are enabled.
B. Battery Icon – Indicates the amount of battery life the TI-CMXDLP has remaining.
C. Detect Indicator – The broken vertical line displays the zero crossing (lank)
detection point on the waveform where the measurement has been obtained. Notice
that the digital thickness readout is the same as the location of the detect indicator
according to the measurements labels F, also in the diagram.
– 61 –
When coniguring the TI-CMXDLP for speciic thru paint applications, all of the scope
parameters will potentially be needed. The delay, range, gain (AGC), thresholds,gates,
and hold-offs will be subject to change. For this reason, they have all been added to Hot
Menu ields located directly beneath the A-Scan display for quick and easy access.
NOTE: Once the values of the ields have been changed or modiied,these changes must
be saved to a setup location prior to powering the TI-CMXDLP off. Failure to do so will
result in losing your changes. Refer to section 12.0 for additional information on setups.
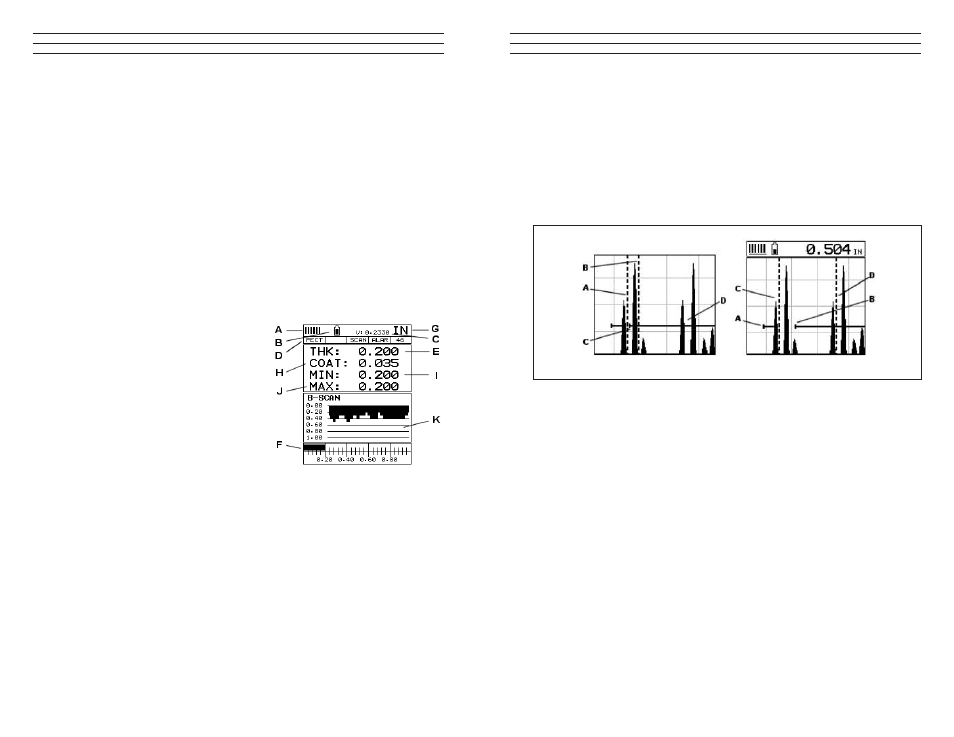
Refer to the incorrect diagram above. Point (A) represents the detection on the irst
back wall echo. The true, second back wall, relection should be detecting at point (D).
However, the hold-off (C) is setup incorrectly and the TI-CMXDLP is detecting the ring
down noise of the transducer, on the irst relection, rather than the true second back wall
relection shown at (D).
Before we look at the diagram with the correct coniguration, let’s consider all of our
options on how to ix the problem beforehand. Our delay and Range will simply change
the view options of the screen – not needed in this example. Will again (AGC) or
threshold adjustment ix the problem? Unfortunately, not. Why?
Notice the amplitude of the cycle just to the left of (B). If we tried to increase the
threshold level above the height of the cycle, we would lose our detection for both
echoes resulting in no reading at all. If we decrease our gain(AGC), reducing the signal
amplitudes, we would also lose our detection of both back wall echoes. Notice that the
amplitude of the cycle just to the left of (C). The amplitude of the cycle, at (C), is less
than the amplitude of the cycle at (B), in terms of overall height. If we decreased our
gain(AGC), we would lose the irst cycle (C) long before losing the second cycle (B).
Therefore, adjusting the gain(AGC) or threshold levels will not help us in this example.
Our inal option is adjusting the GATE2 hold-off, shown at point (C) in the incorrect
diagram, to point (B) in the correct diagram. If we adjust the GATE2 hold-off further
to the right of the irst relection, the ring down noise from the irst back wall echo no
longer interferes with the true detection (D), shown in the correct diagram.
Thru-Paint (Incorrect)
Thru-Paint (Correct)