Sphb graphical trend view, Measure sphb – Welch Allyn Connex Integrated Wall System - User Manual User Manual
Page 99
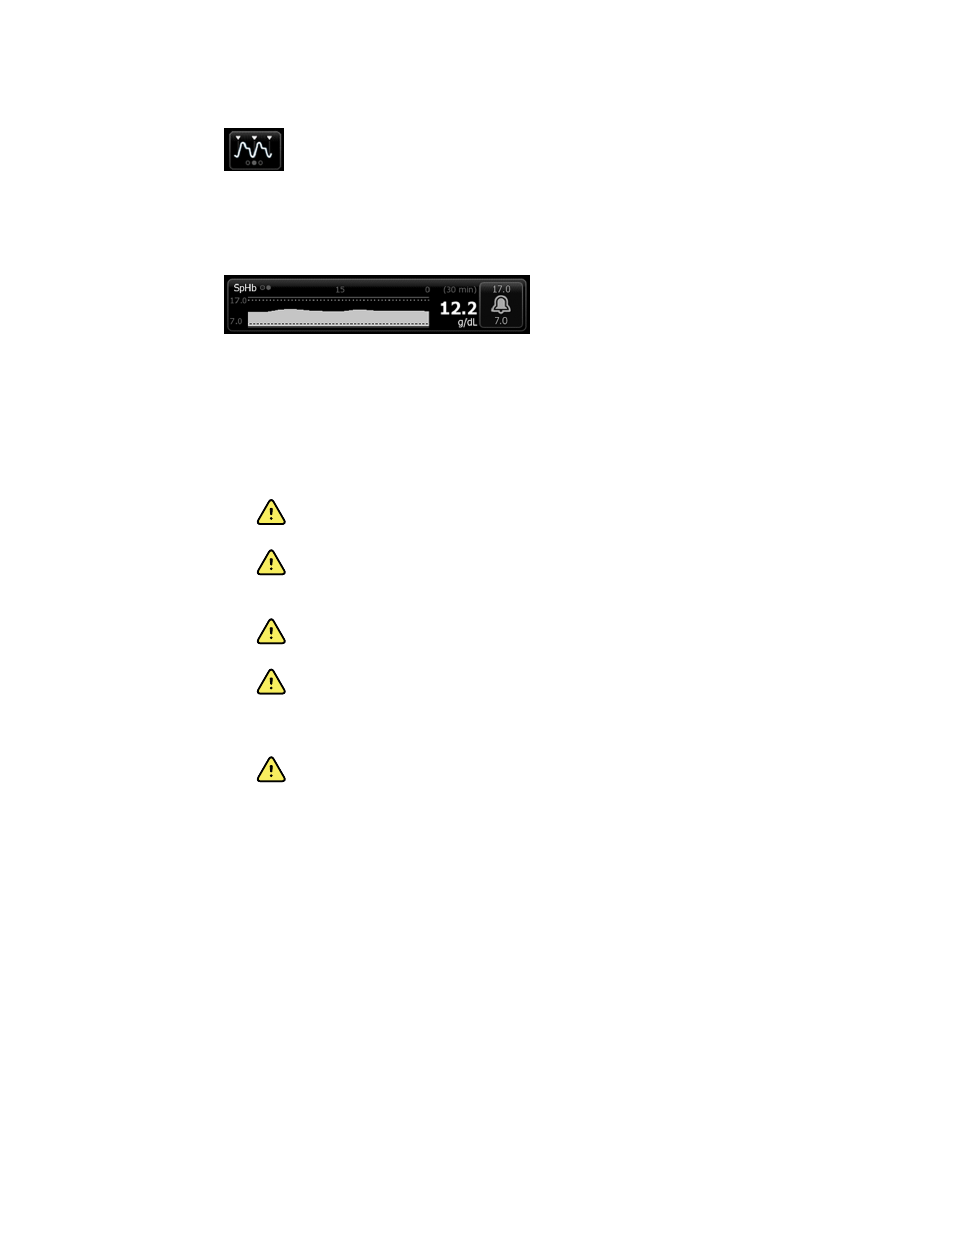
SpHb graphical trend view
The graphical trend view presents a trend of the real-time measurements over a user-selected
period. In Advanced settings, you can select the period displayed.
The graph shows total hemoglobin level on the y-axis and time on the x-axis (oldest measurements
on the left to newest measurements on the right). The entire graph updates every 10 seconds.
To the right of the graph, the frame displays the current measurement in numeric format.
Measure SpHb
WARNING Inaccurate measurement risk. Use only Masimo Rainbow SET sensors
and accessories on Masimo-equipped monitors.
WARNING The pulsations from intra-aortic balloon support can increase the
pulse rate displayed on the monitor. Verify the patient's pulse rate against the ECG
heart rate.
WARNING Patient injury risk. Do not attempt to reprocess, recondition, or recycle
any sensors or patient cables. Doing so might damage electrical components.
WARNING Pulse rate measurement might not detect certain arrhythmias
because it is based on the optical detection of a peripheral flow pulse. Do not use
the pulse oximeter as a replacement or substitute for ECG-based arrhythmia
analysis.
WARNING Use the pulse co-oximeter as an early warning device. As you
observe a trend toward patient hypoxemia, use laboratory instruments to analyze
blood samples to better understand the patient's condition.
Directions for use
Patient monitoring 93