Analysis tab – Rockwell Automation Motion Analyzer Software User Manual
Page 54
54
Rockwell Automation Publication MOTION-UM004B-EN-P - October 2012
Chapter 1
Welcome to Motion Analyzer Software
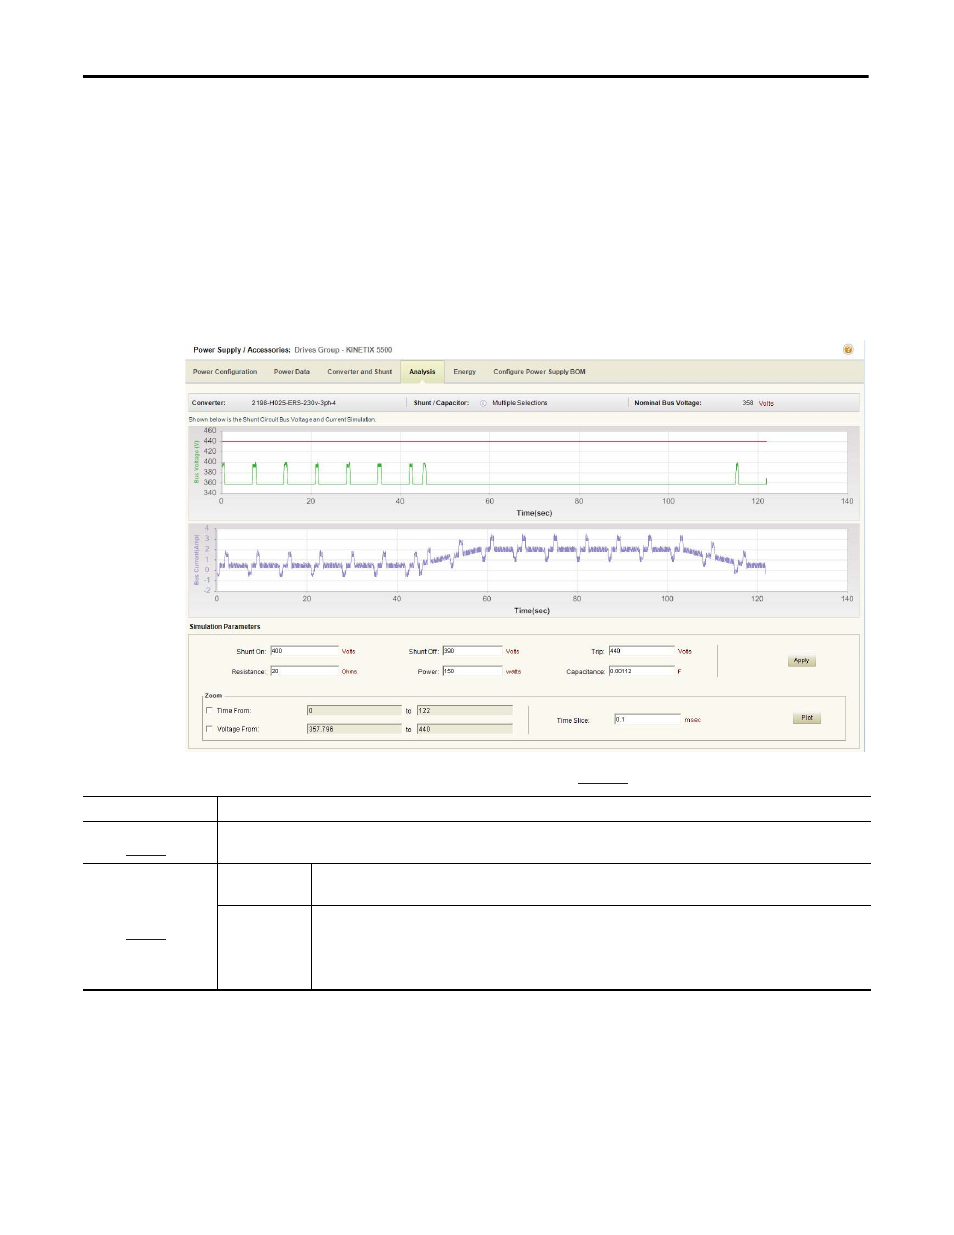
1.2.2.4.4.1.3. Analysis Tab
Click the Analysis tab to conduct detailed analysis of the drive module activity in
terms of bus volts and system current, along with the capability of simulating
changes to the system parameters. The analysis activities are described as follows:
• The red line is the bus voltage trip point.
• The green line is the DC bus voltage.
• The grey line is the bus current.
Figure 40 - Analysis Tab
Table 35 - Analysis Tab Properties (refer to
Parameters
Description
Simulation Parameters
(refer to
Adjust these parameters to observe how changes to the parameters impact the bus voltage and current.
Time From/
Voltage From
Check these boxes to adjust the X- and Y-axis values for the plot.
Time Slice
The Time Slice variable sets the time interval for the analysis display. Because the shunt switching action is modeled during
selection, this value needs to be very short to obtain an accurate shunt selection (0.1 ms, for example). However, if the total cycle
time is more than a few seconds, the calculation time may become excessive.
The time is equal to the longest axis cycle. In the case of a very long length of time, we suggest that a longer time slice be used
for early checks, but a time slice of less than 0.1 ms should be used for the final selection.