Ratio analysis – Rockwell Automation Motion Analyzer Software User Manual
Page 220
220
Rockwell Automation Publication MOTION-UM004B-EN-P - October 2012
Chapter 3
Understanding Your System Solution
3.2.2.1.1. Ratio Analysis
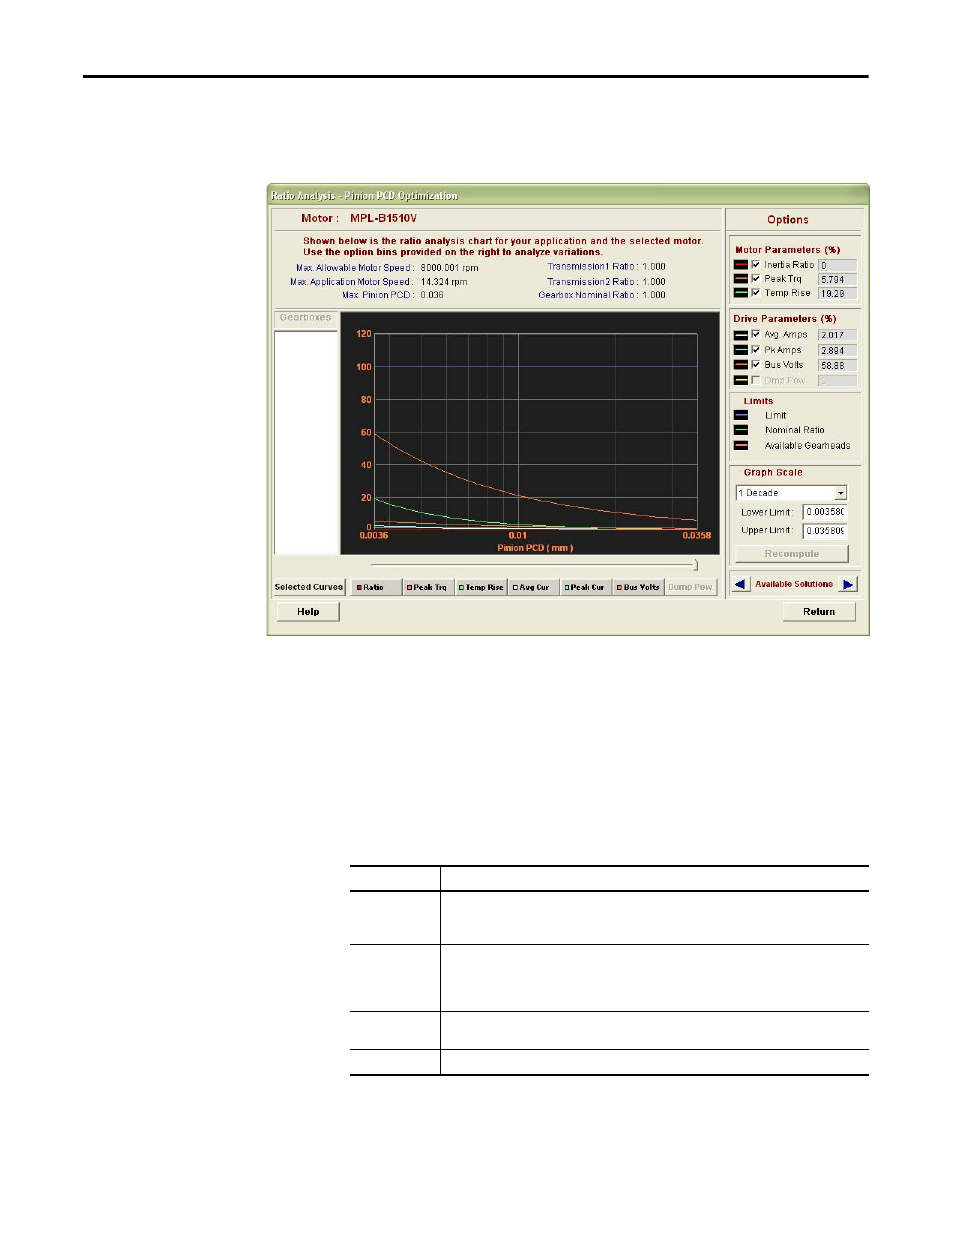
When you select a Ratio Analysis option, the following dialog box opens.
Motor Speed and ratio values are displayed above the graph for reference. The
slider below the chart is available to adjust the ratio you are optimizing. As you
mouse over the slider, the ratio value is displayed.
The buttons below the Ratio Analysis chart select which curves are displayed.
When you click Selected Curves, the motor and drive parameters to the right of
the chart are displayed. If you select another button below the chart, only that
parameter is shown.
Table 131 - Ratio Analysis Options
Motor Speed an
Ratio Value
Parameters
Description
Motor/Drive
Parameters
Check which motor and drive parameters are displayed when you click Selected Curves. The value
for each parameter is listed for the particular gearbox or transmission component ratio indicated
by the slider.
Graph Scale
From the Graph Scale pull-down menu, choose the X-axis scale for the chart. You can set the
Graph Scale to 1, 2 or 3 decades or the scale can be defined. When the User Defined option is
selected, the lower and upper limits for the X-axis of the graph must be entered. Once the axis
limit values are entered, click Recompute to refresh the chart.
Available
Solutions
Click the forward or backward arrow to scroll through the various available solutions.
Return
Click Return to exit.