Rockwell Automation Motion Analyzer Software User Manual
Page 150
150
Rockwell Automation Publication MOTION-UM004B-EN-P - October 2012
Chapter 2
Sizing Your System
Table 84 - Main Profile Plot Properties (refer to
)
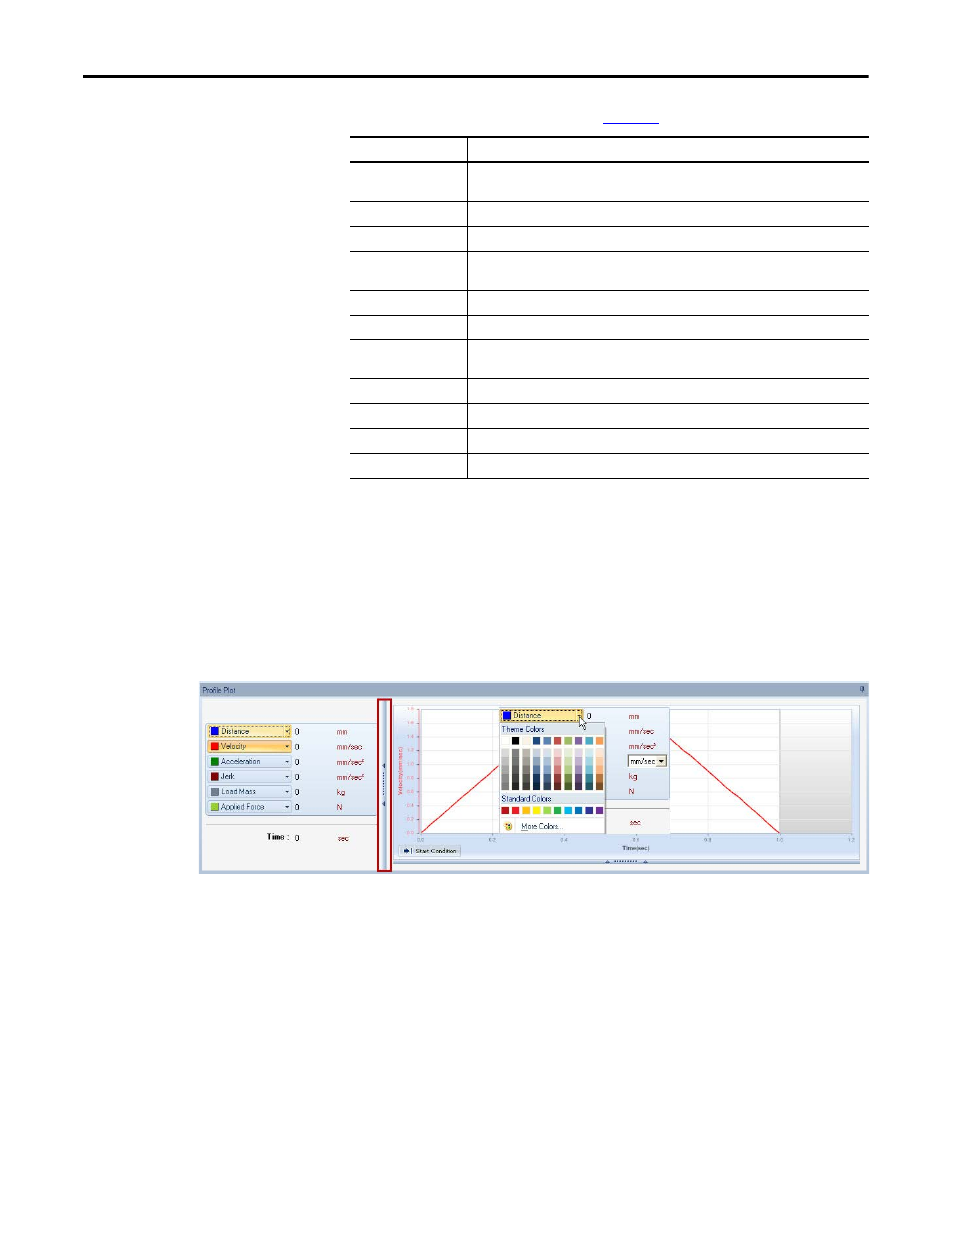
The Plot Parameters sub-window appears to the left of the Main Profile Plot
window. Click the arrows, left of the Main Profile Plot window, to open it. Click
the arrows again to close the window.
Clicking the motion curves (for example, Distance or Velocity) toggles them on
and off. From the motion curve pull-down menu, you can change the color for
the curve in both the Main Profile Plot window and the Segment Plot window.
Figure 111 - Plot Parameters
In addition, as you hover over the Main Profile Plot window with the mouse
pointer, the Plot Parameters sub-window provides a display of the numeric values
of the time (x-axis), and active motion curves (y-axis) associated with the mouse
pointer position.
Parameters
Description
Copy
Create a copy of the selected profile segment to reuse in another location in the motion
profile.
Cut
Remove the selected profile segment to use in another location in the motion profile.
Paste
Replace the selected profile segment with a cut or copied profile segment.
Delete
Deletes the selected profile segment. Also, from the pull-down menu, you can choose the
Delete All option to delete all of the profile segments in the Profile Plot window.
Reset Zoom
Resets the zoom to 1x magnification.
Zoom
Zoom in 1x, 2x, 6x or 8x magnification.
Show Segment
Selection
Select whether or not you would like to highlight the selected profile segment within the
Profile Plot window.
Grid
Select Normal, Fine, or Remove grid.
Color
Adjust the background, curve, and grid colors.
Show Curve
Select which curves you would like to display on the plot (for example, Distance or Velocity).
Show Y Axis
Toggle the Y-axis labels on and off when more than one curve is shown.