Editing chart data – Apple Keynote 3 User Manual
Page 129
Chapter 6
Creating Charts
129
 Depending on the type of chart, the attributes that may change when you change a
chart’s type are as follows: show value label, value label position, text style, series
stroke, series shadow, series fill, data point symbol, and data point fill.
 Bar/column charts and stacked bar/column charts share attributes except for value
label position. Also, bar/column charts have separate fills.
 3D chart shadows are shared across chart types.
When you change a chart’s type and the new type has some of the same attributes,
those attributes don’t change. Shared attributes include axes, gridlines, tick marks, axis
labels, show minimum value, number format, borders, rotation, shadows, and 3D
lighting style.
You’ll learn more about these attributes throughout the remainder of this chapter.
Editing Chart Data
To edit chart data, open the Chart Data Editor and enter your data by typing it or
copying and pasting from Excel, AppleWorks, or another spreadsheet application.
To open the Chart Data Editor:
1
Select a chart on a slide.
2
Click Edit Data in the Chart Inspector (or choose Format > Chart > Show Data Editor).
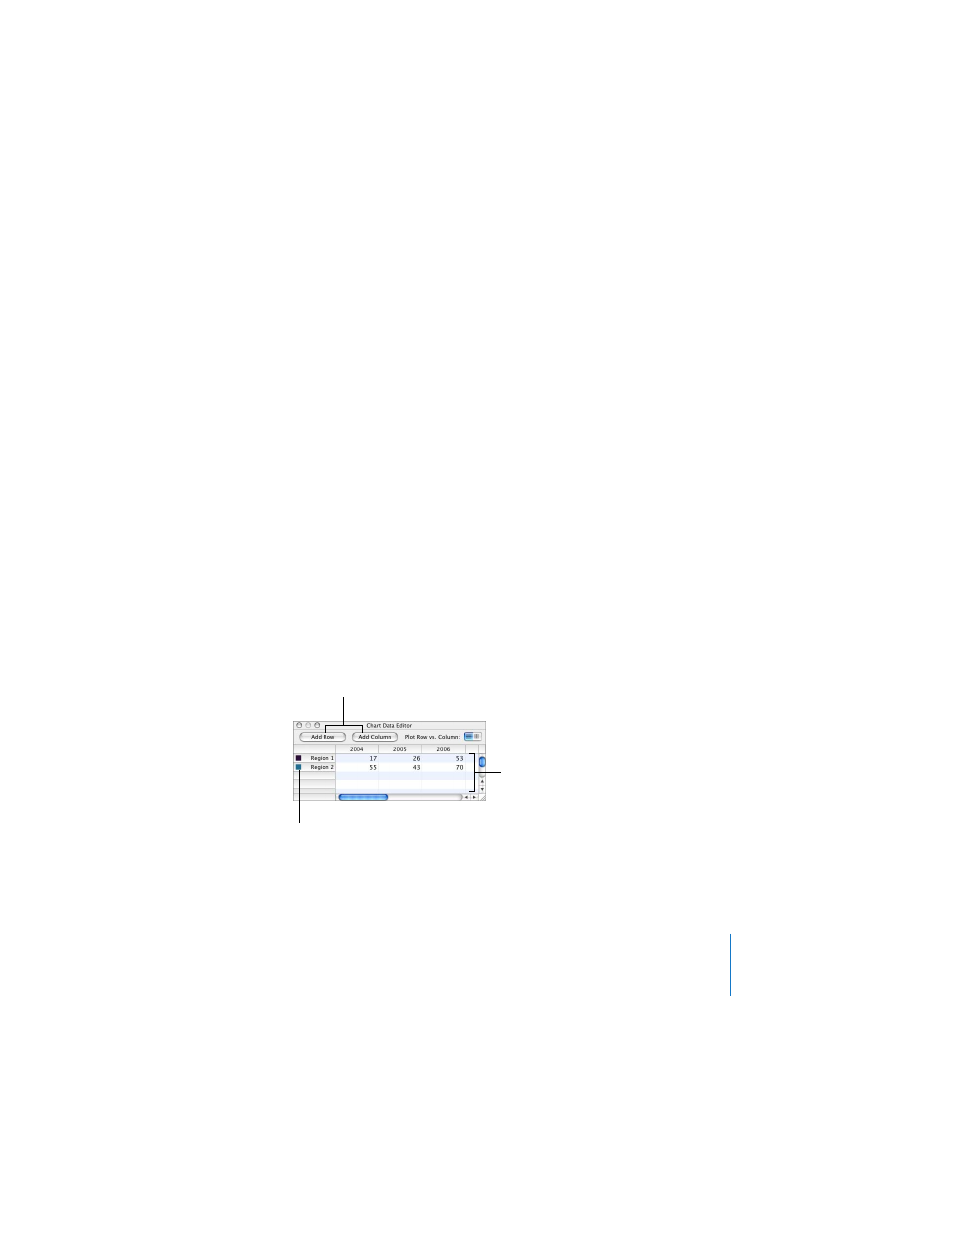
Click these buttons to
add another row or
column for data.
Type chart data directly
into these spreadsheet
cells.
Drag labels to reorder
them.