Apple Keynote 3 User Manual
Page 128
128
Chapter 6
Creating Charts
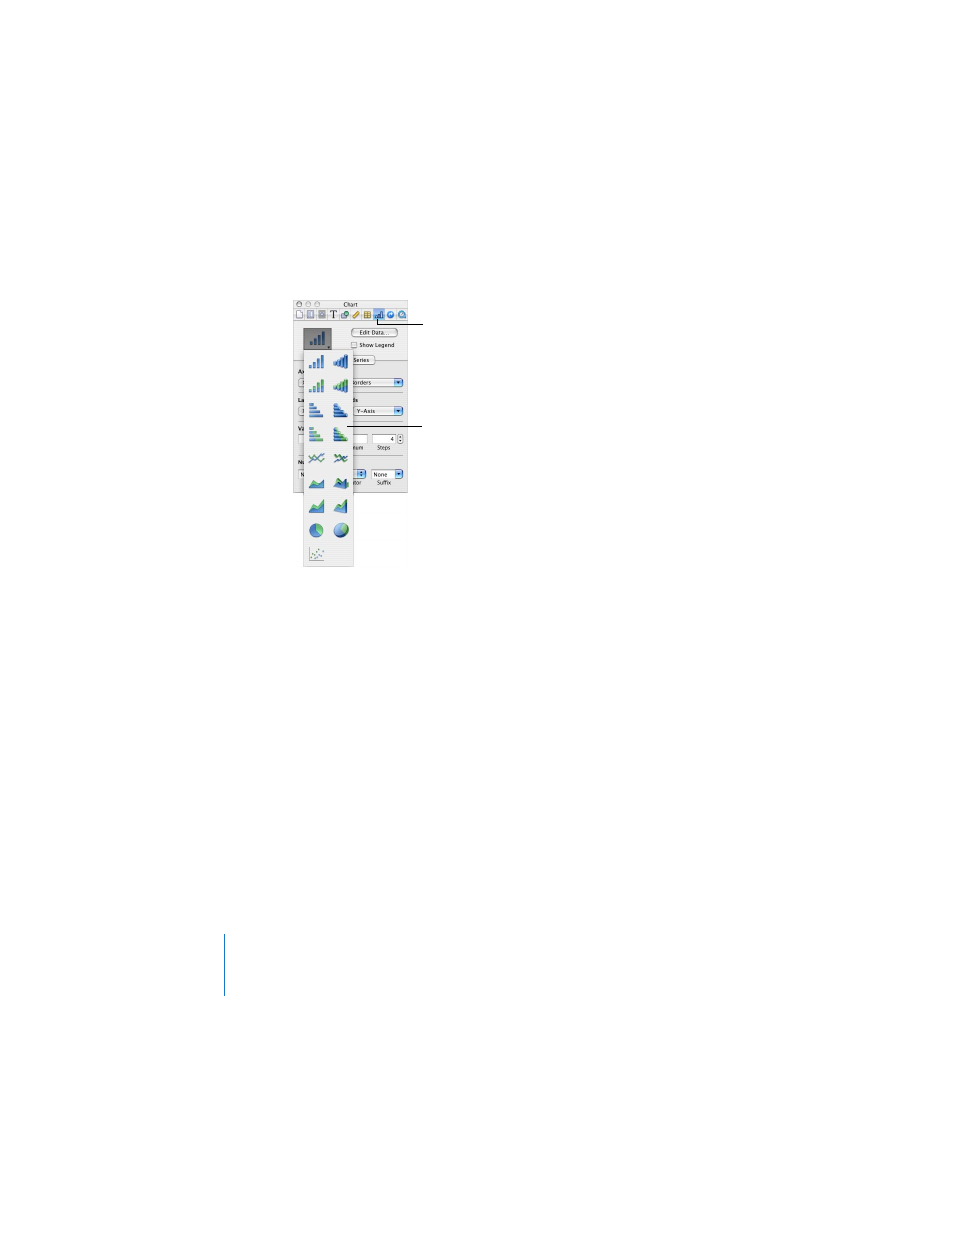
To change a chart from one type to another:
1
Select the chart.
2
In the Chart Inspector, choose a different chart type from the pop-up menu. You can
also choose Format > Chart > Chart Type > [chart type].
 If you switch to a pie chart, Keynote charts only the first data set in the Chart Data
Editor. See “Pie Charts” on page 136.
 If you switch to a scatter chart, each point in the chart requires two values, so every
series uses two columns in the Chart Data Editor. See “Scatter Charts” on page 140.
 If you switch to a bar, column, area, or line chart, each series in the new chart
corresponds to a row in the Chart Data Editor.
 If you switch to a 3D version of a chart, the Chart Inspector provides controls for
managing object depth and lighting style. See “3D Charts” on page 141.
Formatting you’ve applied to the chart you’re changing may not be applied to the
new chart. For example, the color fill attribute has a different default value for each
type of chart. If you’ve changed a column fill color and then change the chart to be a
bar chart, the fill color change isn’t retained.
The Chart Inspector
button
Choose a chart type from the
pop-up menu. 2D charts are
on the left, and 3D charts are
on the right.