Event log views, Event severity, Trace log – HP P6000 Continuous Access Software User Manual
Page 281: Event log views event severity trace log, Event states, Trace, Severity

Event log views
Two views are available in the event pane.
•
Correlated view. The current log, or history log, displays only the last recorded event for each
individual resource. For example, the last recorded event for each storage system. For the
jobs source type, the last recorded event is per job instance is displayed.
•
Standard view. The current log, or history log, displays recorded events for all resources. For
the jobs source type, events for all job instances are displayed. The standard view displays
up to 400 events.
See
Event severity
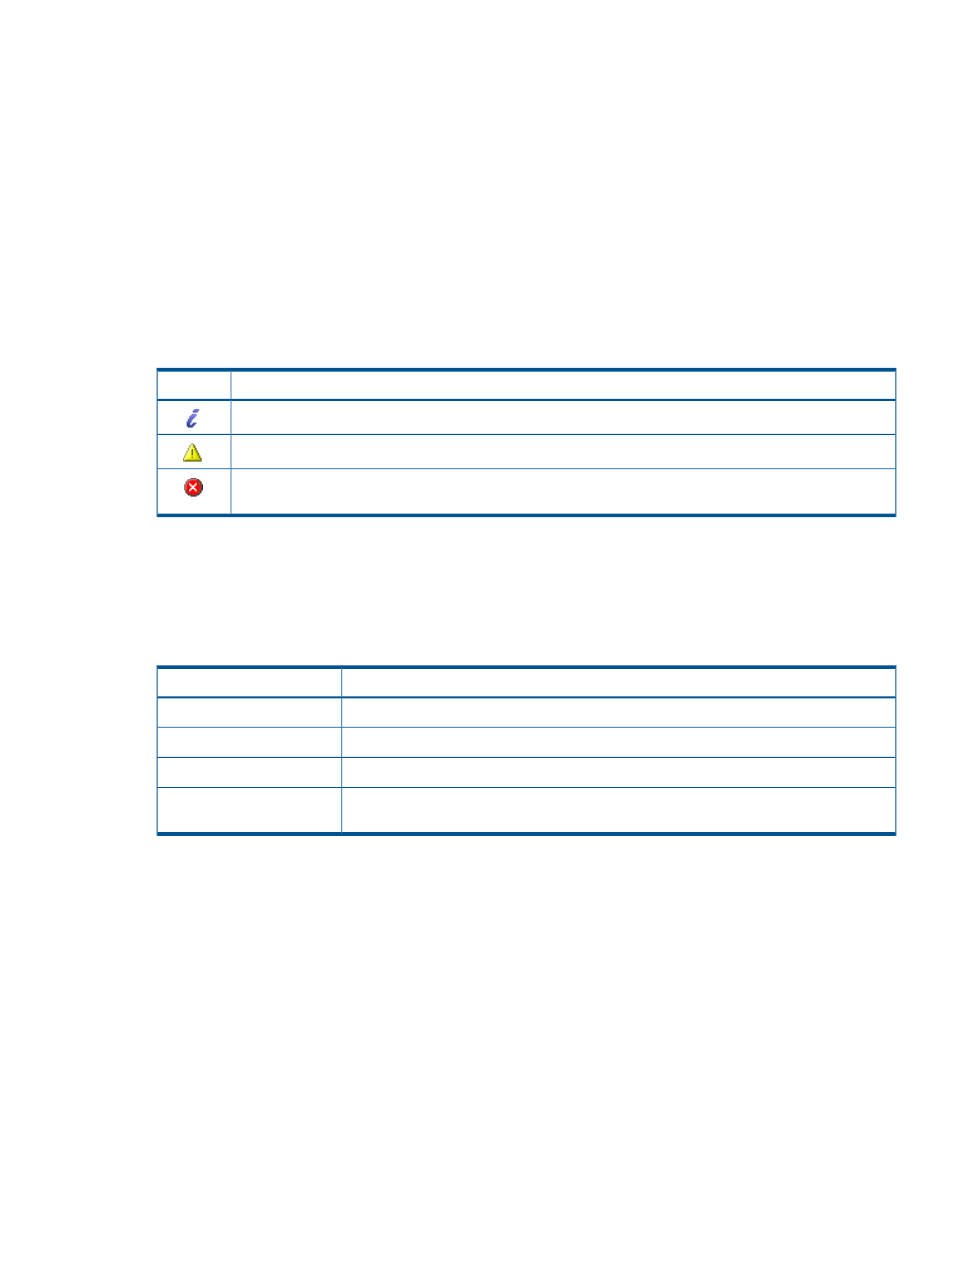
The following icons are used to indicate the severity of an event.
Description
Icon
Informational. The resource was operating normally.
Warning. The resource experienced a temporary abnormal state. The operator should monitor the resource.
Severe. The resource has experienced a catastrophic failure. The operator should act immediately to prevent
further failure or data loss.
Trace log
The replication manager generates and logs many events. See
.
The trace log contains detailed event information that is intended for technical support personnel.
•
Properties
Remarks
Property
Icons indicating the severity of the event. See event and trace log
.
Event Severity
When the event occurred.
Date/Time
Summary description of the event.
Message
Replication manager resource type, job, or CLUI command that wrote the event record.
For example, a storage system resource or a job.
Source
•
As the log gets full, the oldest events are discarded.
•
See also
and
Logs configuration, trace logs
Event concepts
281
