Adjust vertical scale, Observe graph data – GW Instek LCR-8000G Series User Manual
Page 53
GRAPH MODE
105
105
105
105
Adjust vertical scale
Background
When the measured data does not fit into the
original vertical scale, use this function so that the
LCR-8000G automatically adjusts the scale to
include the whole plotted data.
Panel operation
1. If part or all of the plotted data are
out of the vertical range, use the
automatic fit function. Press F1
(Function), then F2 (Fit).
F 1
F 2
(Partially out of range)
CAPACITANCE VS FREQUENCY
FUNCTION
RETURN
20.0
40.0
60.0
80.0
100
(Hz)
300.0n
250.0n
(F)
MKR: 32.000 Hz
Cs : 25.000nF
LEVEL: 10.0mV
SPEED:FAST
(Totally out of range)
CAPACITANCE VS FREQUENCY
FUNCTION
RETURN
20.0
40.0
60.0
80.0
100
(Hz)
300.0n
250.0n
(F)
MKR: 32.000 Hz
Cs : 25.000nF
LEVEL: 10.0mV
SPEED:FAST
2. The vertical range is automatically adjusted to
include the whole plotted data.
CAPACITANCE VS FREQUENCY
FUNCTION
RETURN
20.0
40.0
60.0
80.0
100
(Hz)
400.0n
100.0n
(F)
MKR: 60.000 Hz
Cs : 60.000nF
LEVEL: 10.0mV
SPEED:FAST
LCR-8000G Series User Manual
106
106
106
106
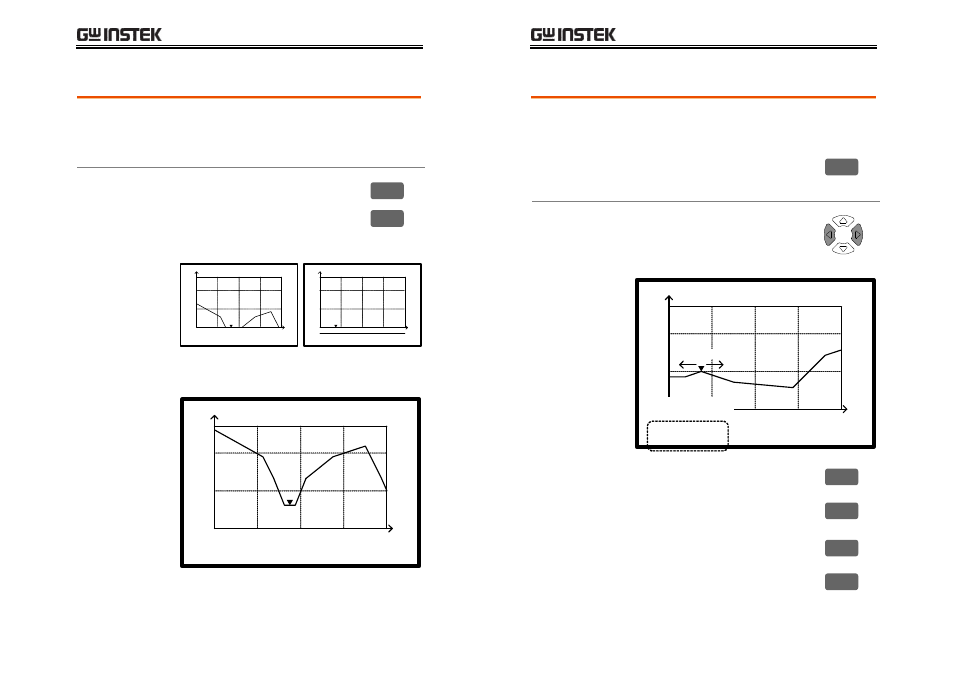
Observe Graph Data
Background
When the graph is completed (page103) and the
vertical scale is adjusted (page105), use the marker
to observe the measurement data in detail.
In the configuration mode, if the graph
is already available, it can be viewed by
pressing F6 (View).
F 6
Panel operation
1. To move the marker, press the
Left/Right key. As the marker
moves, the marker position and
measurement data changes.
CAPACITANCE VS FREQUENCY
FUNCTION
RETURN
20.0
40.0
60.0
80.0
100
(Hz)
300.0n
250.0n
(F)
MKR: 32.000 Hz
Cs : 250.00nF
LEVEL: 10.0mV
SPEED:FAST
Marker
Marker position and
Measurement data
Move marker to
the peak
2. To move the marker to the peak of
the plot, press F1 (Function) and F3
(Peak). Press F1 (View) to go back to
the previous display.
F 1
F 3
Move marker to
the bottom
3. To move the marker to the bottom of
the plot, press F1 (Function) and F4
(Dip). Press F1 (View) to go back to
the previous display.
F 1
F 4