6 the graphical window (gas view), Figure 4.48 – LumaSense Technologies LumaSoft Gas Multi Point 7860 User Manual
Page 84
Chapter 4
_________________________________________________________________________
________________________________________________________________________
BE6027-12
LumaSoft Gas Software
LumaSense Technologies A/S
7810 and 7860
Page 84 of 194
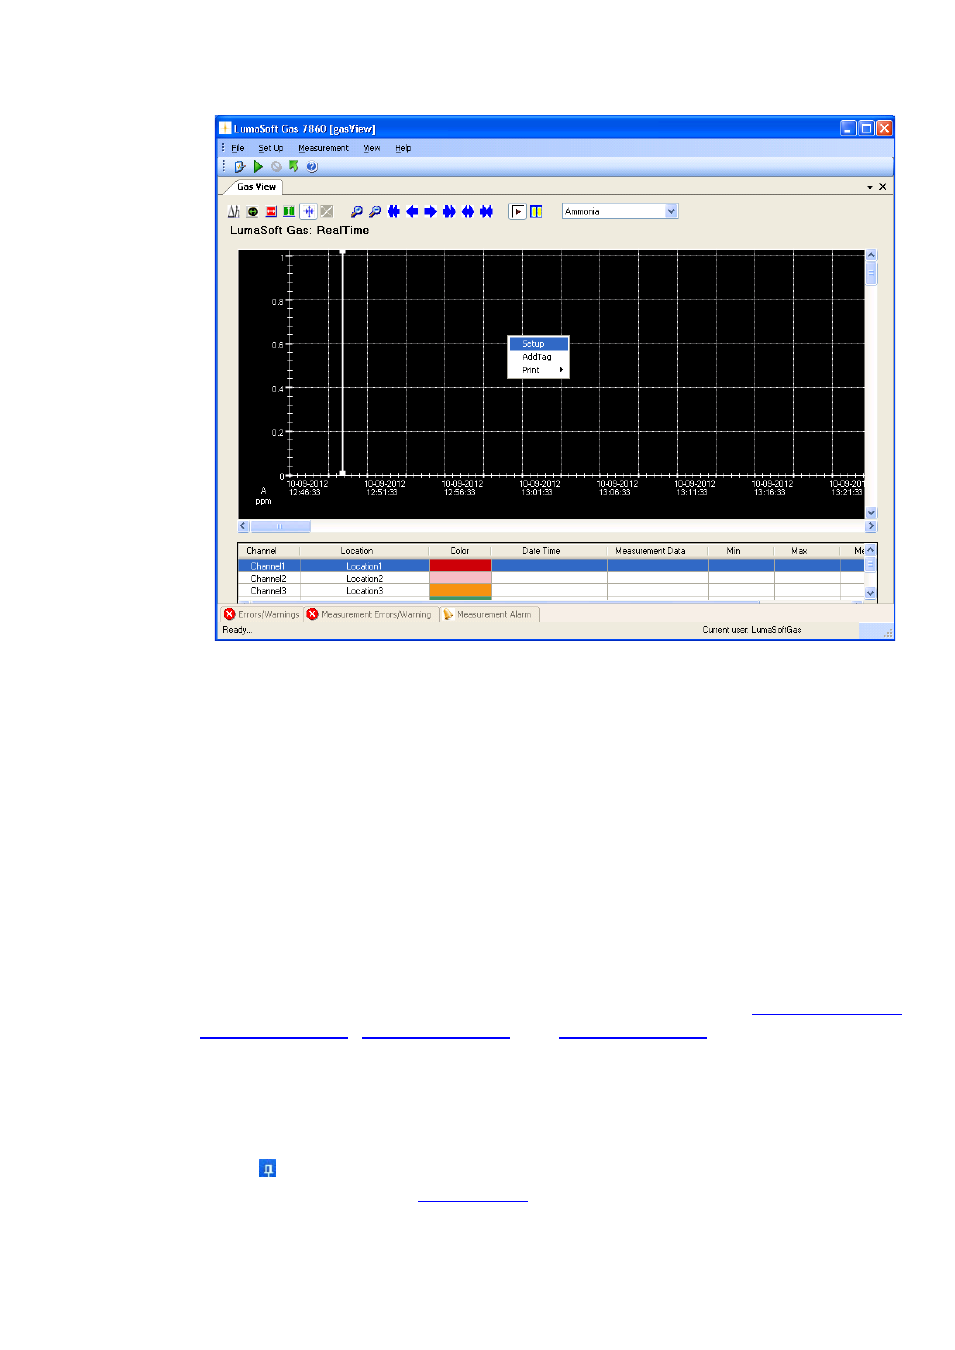
Figure 4.48 To change the configuration in the graphical window(Gas
View) press the right button on the mouse
To change (add or remove) the selected channels, press the right mouse
button while the cursor is placed in the graph area and select AddTag.
(See Figure 4.48)
4.2.2.6
The Graphical Window (Gas view)
The graphic window shows the measurement data in a graph. Each filter
in the Monitor has its own axis on the graph, see Figure 4.18. Below the
graph a window containing a list of the measured gases, and statistics
performed from all obtained measurement data (Min, Max, Mean and
Std. Deviation) is shown. The bottom window is the Error and
Warnings and Alarm window. The number of curves displayed, their
color and style are defined by the user as described in
and
The user can toggle between the Errors/Warnings, Measurement
Errors/Warnings and Measurement Alarm windows. The
Errors/Warnings window will register if any errors have occurred while
running the measurement. The window can be hidden by pressing Auto
Hide icon, or by selecting Errors/Warnings Window in the View