1 configuration of the (gas-view) graphical window – LumaSense Technologies LumaSoft Gas Multi Point 7860 User Manual
Page 76
Chapter 4
_________________________________________________________________________
________________________________________________________________________
BE6027-12
LumaSoft Gas Software
LumaSense Technologies A/S
7810 and 7860
Page 76 of 194
4.2.2.1
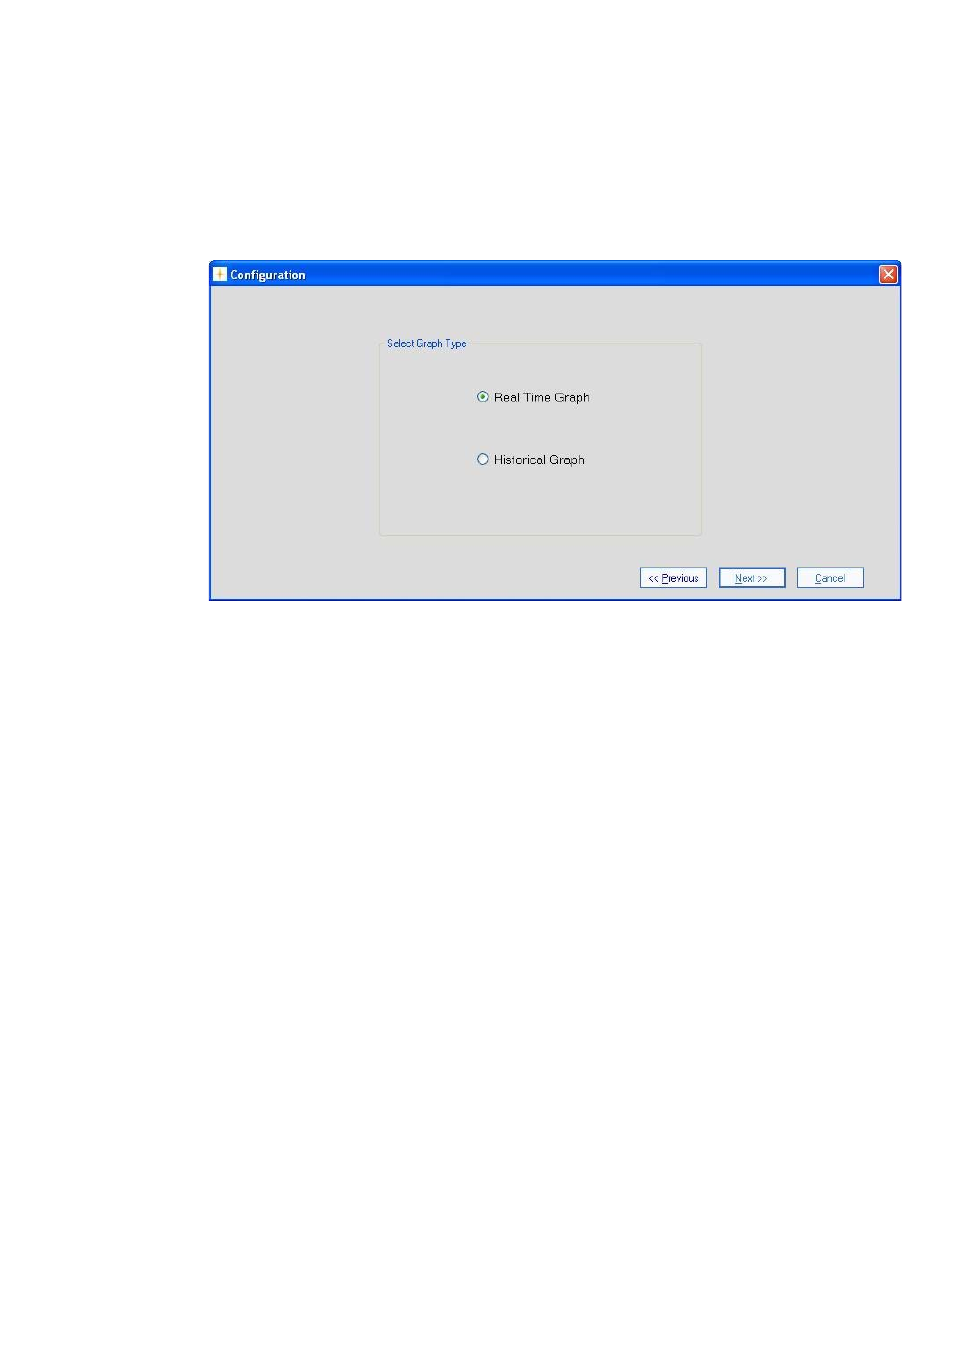
Configuration of the (Gas-View) graphical window
In the Configuration window select if the data should be presented as
a Real Time Graph, while measurement is in progress, or Historical
Graph, see Figure 4.37.
Figure 4.37 Select if the data should be presented in real time or historic
Real Time Graph means that measurement data will be plotted as they
arrive from the Monitor.
Historical Graph means viewing of previously measured data
Select Real Time Graph and press Next to continue.
This manual is related to the following products: