Figure – LumaSense Technologies LumaSoft Gas Multi Point 7860 User Manual
Page 114
Chapter 4
_________________________________________________________________________
________________________________________________________________________
BE6027-12
LumaSoft Gas Software
LumaSense Technologies A/S
7810 and 7860
Page 114 of 194
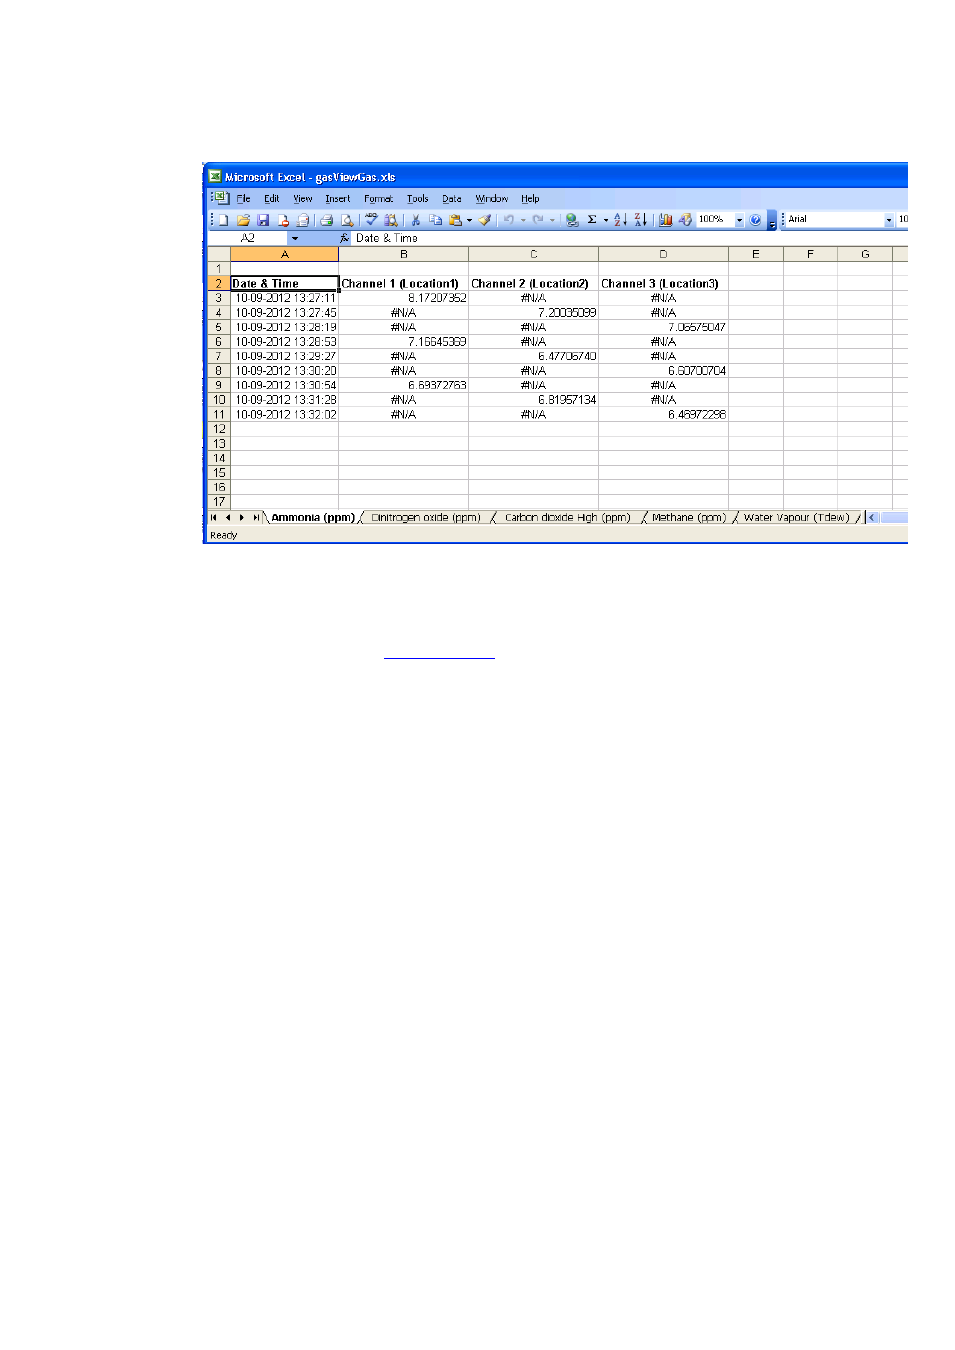
Each measurement is time stamped.
Figure 4.93 Gas measurement data in Excel.
The Excel Chart wizard can now be used to generate for instance a line
graph as shown in
This manual is related to the following products: