Yokogawa Integral Oxygen Analyzer ZR202 User Manual
Page 144
<10. Other Functions>
10-6
IM 11M12A01-02E
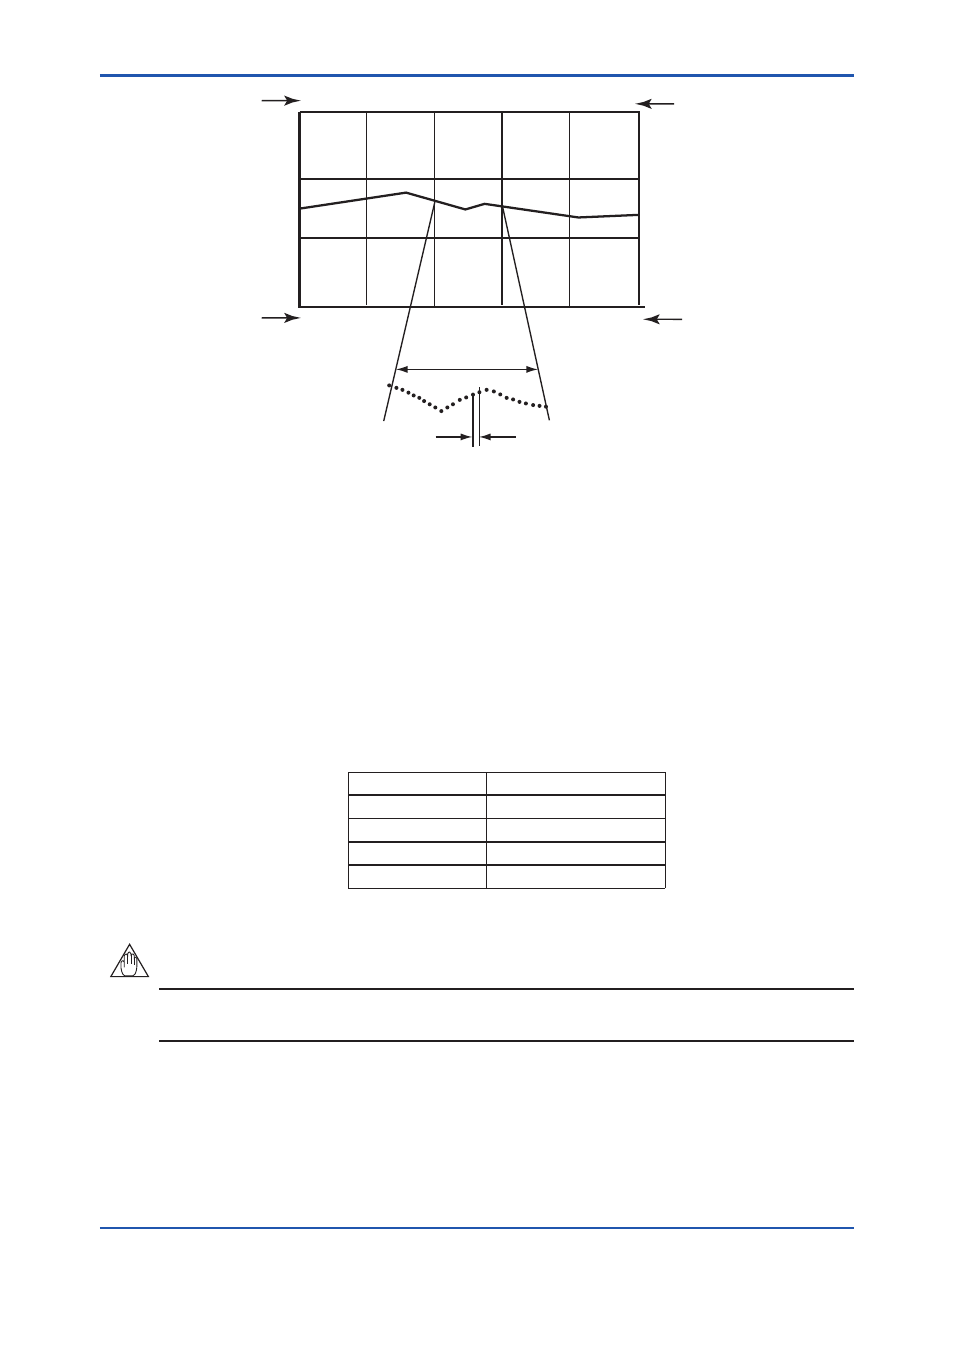
0.0 vol%O
2
25.0 vol%O
2
10 min./div
12.3 vol%O
2
60 data
Preset upper limit
Preset lower limit
Time per division,
calculated by the set
sampling interval
Currently measured
value
Sampling period
F10.5E.ai
Figure 10.5 Plotting Graph for Sampling Interval
10.1.2.3 Setting Upper and Lower Limit Values on Graph
Set upper- and lower-limit values on the graph in the following procedure:
Press “Upper limit” in the Trend graph display. The numeric-data entry key appears.
Enter the upper-limit value. Also enter the lower-limit value in the same way. The allowable
settings for both upper-limit and lower-limit values range from 0 to 100 vol%O
2
.
10.1.2.4 Default Setting
When the analyzer is delivered, or if data are initialized, the set data are by default, as shown in
Table 10.3.
Table 10.3 Default Values for Graph Setting
Item Default
Value
Parameter
Oxygen concentration
Sampling interval
30 seconds
Upper limit
25 vol%O
2
Lower limit
0 vol%O
2
NOTE
If a rapid change in the measured value occurs during sampling, no sampled data are plotted on
the graph. Use the graph indication tentatively. Check the output current for accurate data.
8th Edition : Jan.13,2012-00