2 trend graph, 2 trend graph -5, Trend graph – Yokogawa Integral Oxygen Analyzer ZR202 User Manual
Page 143
<10. Other Functions>
10-5
IM 11M12A01-02E
10.1.2 Trend Graph
Press the [Graph display] key in the Basic panel display to switch to the graph display.
This will help grasp the measured-value trend. Touching anywhere on the graph display will
return to the Basic panel display. To set the Trend graph display, follow the steps in Section
10.1.2.1.
10.1.2.1 Setting Display Items
(1) Press the [Setup] key in the Basic panel display to display the Execution/Setup display.
Select “Maintenance” from the Execution/Setup display.
(2) Select “Display setup” from the Maintenance display.
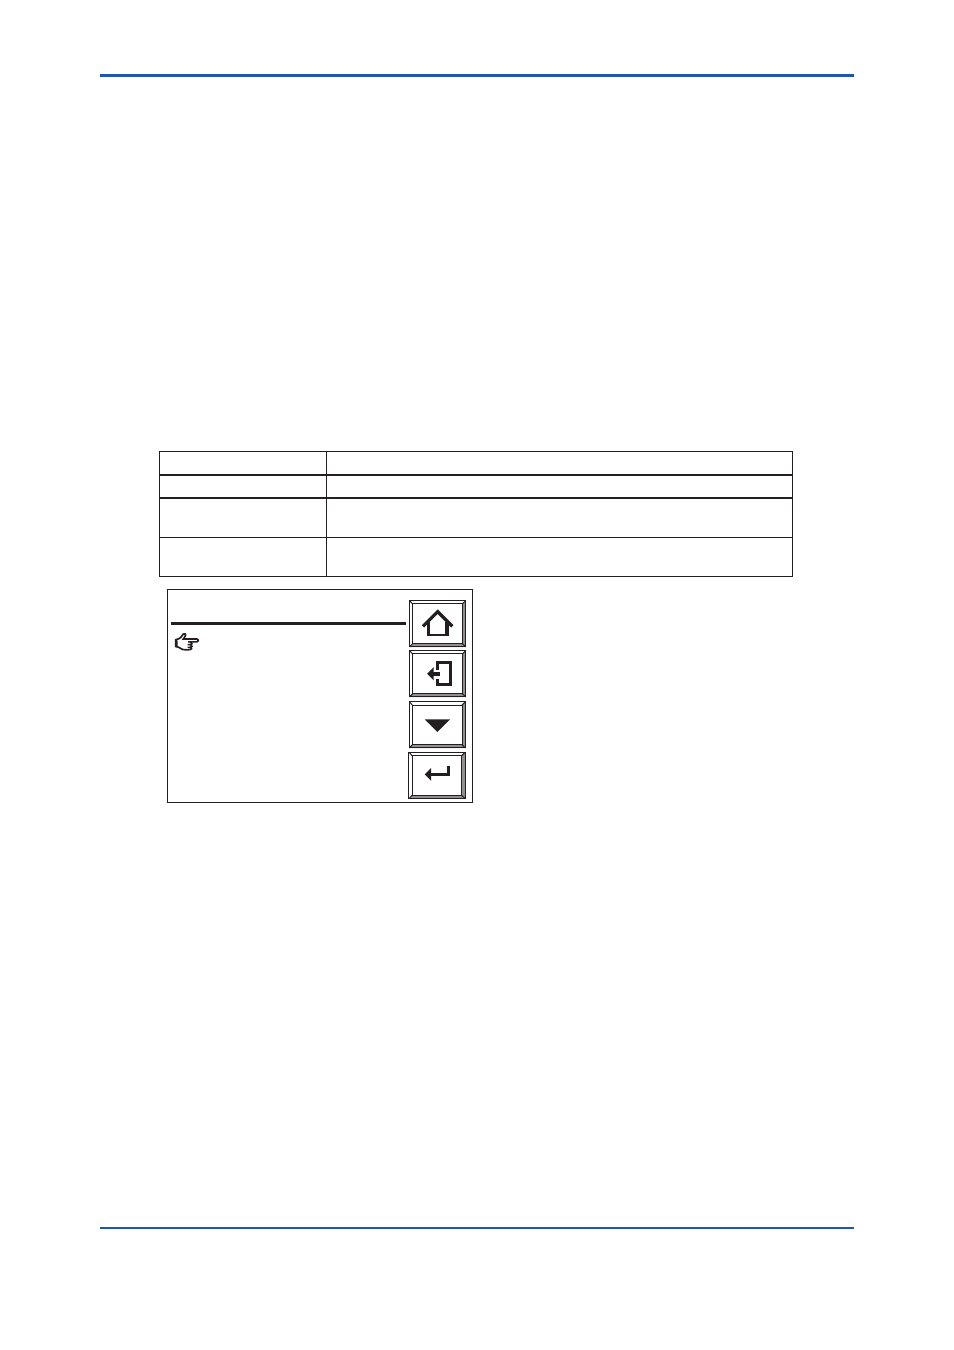
(3) Select “Trend graph” from the Display setup display. The Trend graph display shown in
Figure 10.4 appears.
(4) Select “Parameter: Oxygen” from the Trend graph display. Then select the desired display
item shown in Table 10.2.
Table 10.2 Trend Graph Display Items
Selected item
Description
Oxygen concentration
Oxygen concentration graph under measurement
Output 1
If this equipment is for the oxygen analyzer, the trend graph will be an
oxygen concentration graph.
Output 2
If this equipment is for the oxygen analyzer, the trend graph will be an
oxygen concentration graph.
Enter
Parameter:
Oxygen
Sample interval: 3 0 s
Scale Oxygen
Upper limit: 2 5 . 0 % O
2
Lower limit: 0 . 0 % O
2
Trend graph
F10.4E.ai
Figure 10.4 Trend Graph Display
10.1.2.2 Sampling Interval
To plot a graph, set the “Sampling interval” for the measurement data.
This graph allows the plotting of 60 data items on one division on the time axis. So, if you set
a ten-second sampling interval, one division corresponds to 600 seconds (Figure 10.5). The
allowable sampling intervals range from 1 to 30 seconds. If you set a one-second sampling
interval, the axis of the abscissas then corresponds to five minutes.
If you set it to 30 seconds, the axis of the abscissas then corresponds to 150 minutes.
8th Edition : Jan.13,2012-00