3 compensation, Compensation -3 – Yokogawa Integral Oxygen Analyzer ZR202 User Manual
Page 131
<9. Calibration>
9-3
IM 11M12A01-02E
8th Edition : Jan.13,2012-00
9.1.3
Compensation
The deviation of a measured value from the theoretical cell electromotive force is checked by the
method in Figure 9.2 or 9.3.
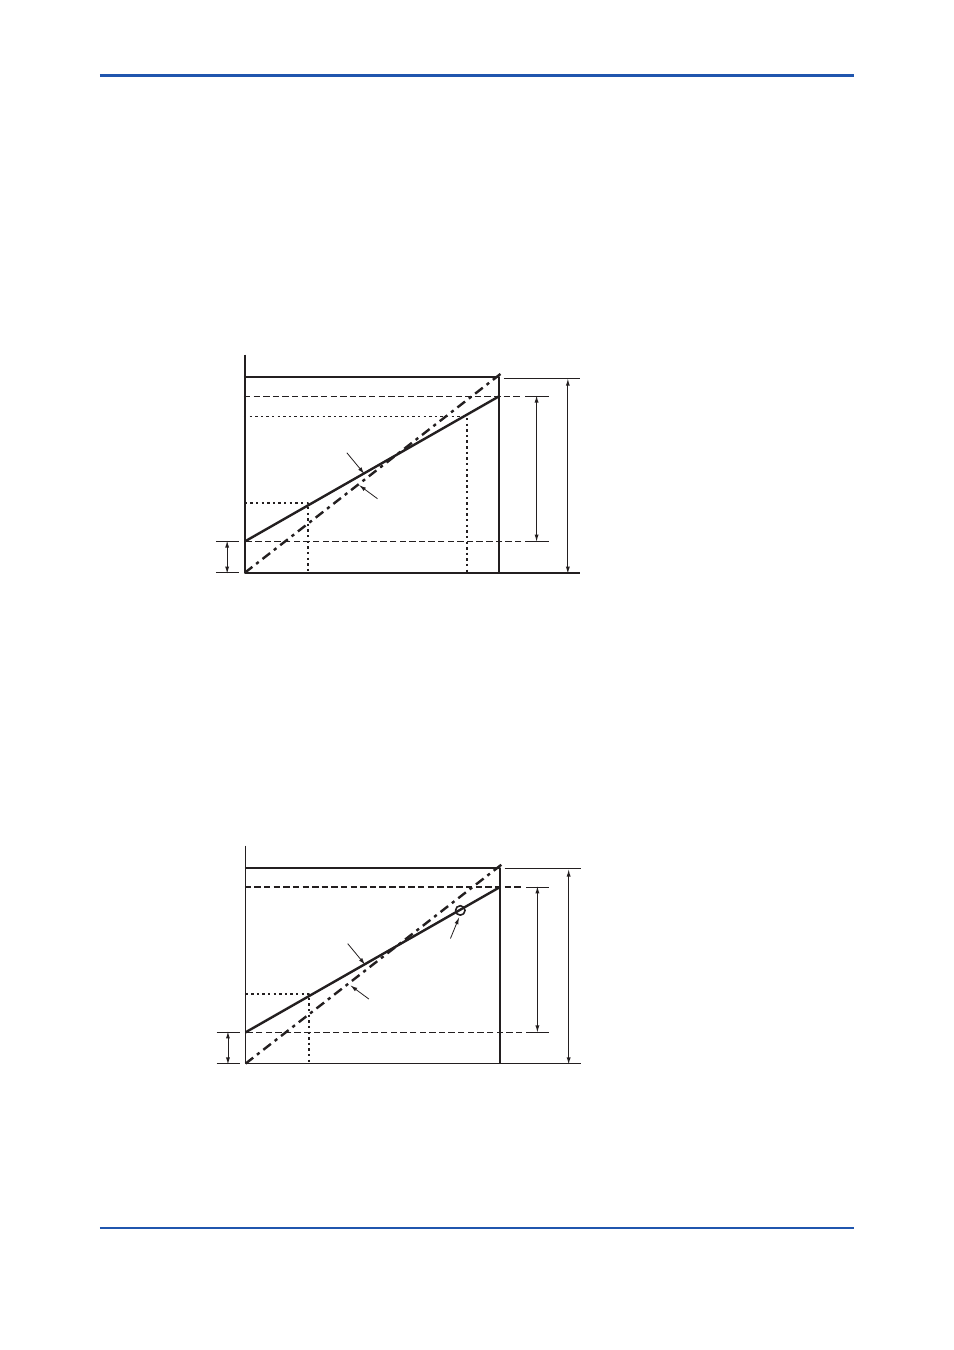
Figure 9.2 shows a two-point calibration using two gases: zero and span. Cell electromotive
forces for a span gas with an oxygen concentration p1 and a zero gas with an oxygen
concentration p2 are measured while determining the calibration curve passing between these
two points. The oxygen concentration of the sample gas is determined from this calibration
curve. In addition, the calibration curve corrected by calibration is compared with the theoretical
calibration curve for determining the zero-point correction ratio represented by B/A x 100 (%) on
the basis of A, B and C shown in Figure 9.2 and a span correction ratio of C/A x 100 (%). If the
zero-point correction ratio exceeds the range of 100 ± 30% or the span correction ratio becomes
larger than 0 ± 18%, calibration of the sensor becomes impossible.
Figure 9.2 Calculation of a Two-point Calibration Curve and Correction Ratios using Zero and
Span Gases
Figure 9.3 shows a one-point calibration using only a span gas. In this case, only the cell
electromotive force for a span gas with oxygen concentration p1 is measured. The cell
electromotive force for the zero gas is carried over from a previous measurement to obtain the
calibration curve. The principle of calibration using only a span gas also applies to the one-point
calibration method using a zero gas only.
Figure 9.3 Calculation of a One-point Calibration Curve and Correction Ratios using a Span Gas
21.0
p1
p2
0.51
81.92
ez
e2
e1
es
0
C
A
B
Zero-point correction ratio = (B/A) x 100 (%) Correctable range: 100 ± 30%
Span correction ratio = (C/A) x 100 (%) Correctable range: 0 ± 18%
Cell
electromotive
force, mV
Calibration curve
before correction
Corrected calibration
curve (theoretical
calibration curve)
Zero origin
Span gas concentration
Zero gas concentration
Span origin
Oxygen concentration (vol%O
2
)
F9.2E.ai
21.0
p1
0.51
81.92
ez
e1
es
0
C
A
B
Zero point correction ratio = (B/A) x 100 (%) Correctable range: 100 ± 30%
Span correction ratio = (C/A) x 100 (%) Correctable range: 0 ± 18%
Cell
electromotive
force, mV
Calibration curve before
correction
Previous
zero gas data
Corrected calibration curve
(theoretical calibration curve)
Zero origin
Span origin
Span gas concentration
Oxygen concentration (vol%O
2
)
F9.3E.ai