Teledyne LeCroy SAS Suite User Manual User Manual
Page 188
Version 6.25
SASSuite User Manual
178
LeCroy Corporation
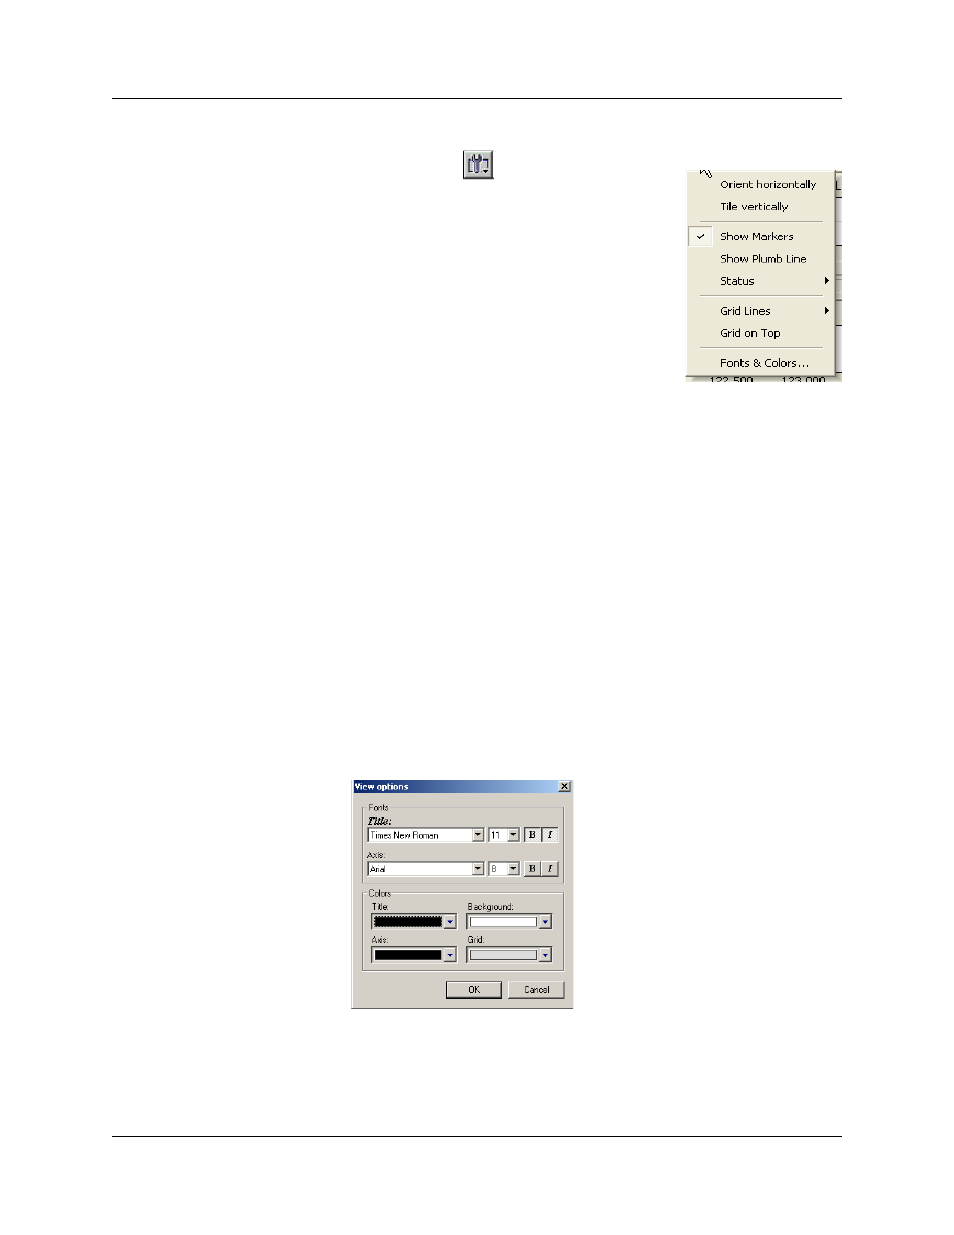
View Settings Menu
Clicking the View settings button
causes a menu to open
with options for formatting the display.
•
Orient Horizontally - changes the orientation
of bus usage to horizontal. After selecting
this option, the menu will say "Orient
Vertically."
•
Tile Vertically - tiles the two graphs vertically
(i.e., side by side).
•
Show Markers - Places "tick" marks along
the x axis of each graph.
•
Show Plumb Line - Displays a vertical line
that connects your cursor to the horizontal
axis. As the mouse is moved, the status bar will show the packet and
time frame to which the cursor is pointing.
•
Status - Opens a sub-menu with the following options:
— Bar - Displays a status bar at bottom of graph.
— Tooltip - Causes a tooltip to appear if you position your mouse pointer
over part of the graph and leave it there for a couple of seconds.
— None - Turns off tooltips and the status bar.
•
Grid Lines - Opens a sub-menu with the following options:
— Both - Displays both X and Y axis gridlines
— X Axis - Displays X axis gridlines
— Y Axis - Display Y axis gridlines
— None - Turns off gridlines
•
Grid on Top - Moves the grid lines above the graph.
•
Fonts and Colors - Opens a dialog box for setting the colors and fonts
used in the graphs: