Traffic summary - performance – Teledyne LeCroy Kibra DDR User Manual
Page 144
Teledyne LeCroy
Traffic Summary
142
Kibra DDR Protocol Analyzer User Manual
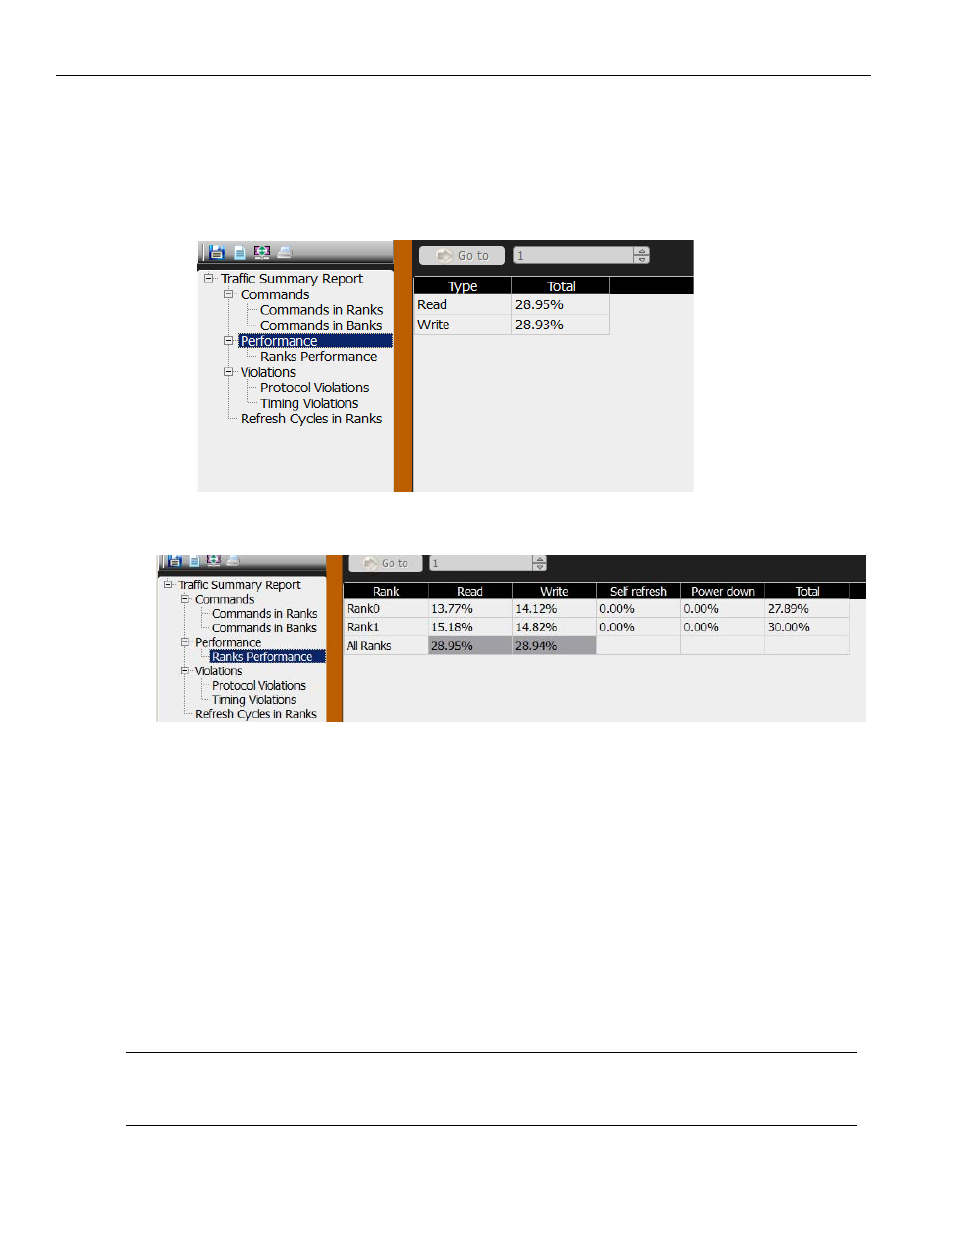
Traffic Summary - Performance
A summary of the Performance can be viewed on this page. You can view a total
percentage of the Read, Write, Self refresh and Power down commands (see Figure 3.58).
You can view Ranks Performance.
Figure 3.58: Traffic Summary - Performance
Figure 3.59: Traffic Summary -Ranks Performance
The Performance node of the Traffic Summary Report provides a high level snapshot of
bus bandwidth usage and power‐down state transitions during trace capture. It shows
the bus bandwidth efficiency for data transfers and the efficiency of power down state
transitions when no data transfers occur. The report is calculated based on rank and is
determined by counting the clocks that occurred while the rank was in a specific state
according to these formulas:
Read: (Number of read commands * burst clock count [BL/2] * 100) / Total clock
count
Write: (Number of write commands * burst clock count [BL/2] * 100) / Total
clock count
Self Refresh: (Total self refresh state duration * 100) / Trace duration
Power Down: (Total power down state duration * 100) / Trace duration
Note:
Read/Write states values are calculated by counting the number of clocks required to complete
a burst transaction. For burst length 8, software counts 4 clocks. For burst length 4, the software
counts 2 clocks.