6 calibrating the concentration measurement – K-Patents PR-23 User Manual
Page 56
48
PR-23 instruction manual
6.6 Calibrating the concentration measurement
mA OUTPUT
FIELD CALIBRATION
CHEMICAL CURVE
n
D
CCD
TEMP
Pt-1000
Indicating
transmitter
DTR
Sensor
CONC
CALC
1.
2.
3.
4.
5.
6.
DAMPING
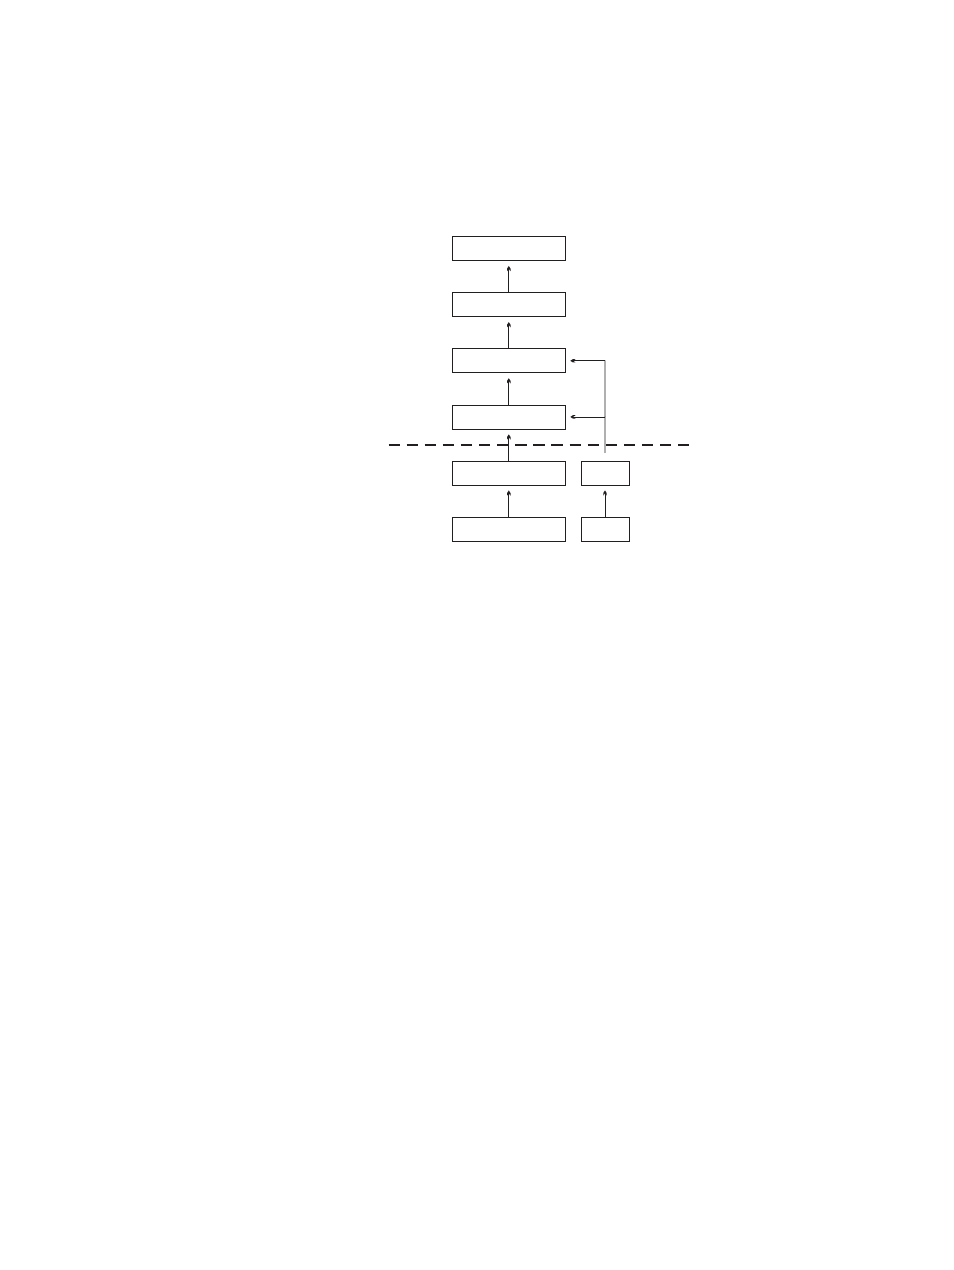
Figure 6.12
The six layers of
concentration calibration
The concentration calibration of
the K-Patents inline refractome-
ter PR-23 is organized in six lay-
ers.
1. The information from the
CCD element and the Pt-1000
temperature element.
The
position of the shadow edge
(Figure 1.4, “Optical image
detection”) is described by
a number called CCD and
scaled from 0–100 %.
2. The sensor calibration: The
actual refractive index n
D
is
calculated from the CCD value.
The process temperature is
calculated from the Pt-1000
resistance. The sensor out-
put is n
D
and temperature TEMP
in Centigrade.
Hence, the
calibrations of all PR-23 sensors are identical, which makes sensors interchange-
able. Furthermore, the calibration of each sensor can be verified using standard
refractive index liquids, see Chapter 13.
3. The chemical curve: The Indicating transmitter DTR receives n
D
and TEMP and cal-
culates the concentration value according to chemical curves derived from avail-
able chemical literature and K-Patents expertise. The result is a temperature com-
pensated calculated concentration value CALC.
4. Field calibration: Adjustment of the calculated concentration value CALC may be
required to compensate for some process conditions or to fit the measurement to
the laboratory results. The Field calibration procedure, Section 6.6.3, determines
the appropriate adjustment to CALC. The adjusted concentration is called CONC.
If there is no adjustment, CALC and CONC are equal. Thus the chemical curve is
kept intact as a firm base for the calculation, the adjustment is merely additional
terms.
5. Damping: See Section 6.1.
6. Output signal: The range of the 4 to 20 mA signal is defined by its two endpoints
on the CONC scale, see Section 6.5.1.