K-Patents PR-23 User Manual
Page 43
5 Startup and use
35
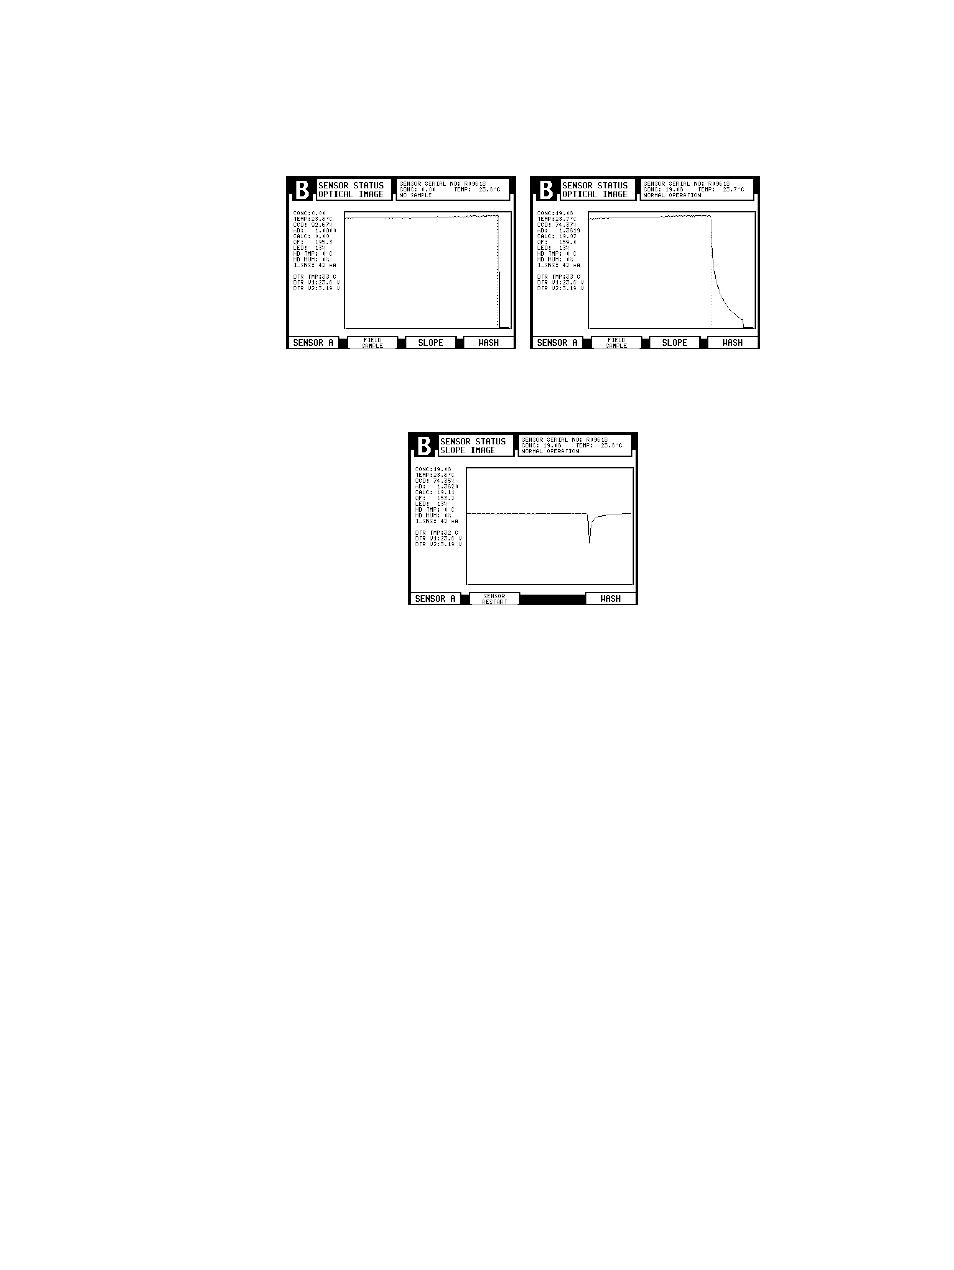
Empty pipe
Normal conditions
Figure 5.8
Typical optical images with IDS
Figure 5.9
A slope graph with IDS
It should be noted that the "empty" optical image may have vertical left and/or right
edge close to the edge of the image. In the example, only the right edge is visible.
5.4.3 Diagnostic values
The values at the left of the graph are used for diagnostic purposes:
−
CONC
is the final concentration value including Field calibration adjustment, see
Figure 6.12.
−
TEMP
, see Section 5.4.4.
−
CCD
gives the position of the shadow edge on CCD in %.
−
nD
is the refractive index value n
D
from the sensor.
−
CALC
is the calculated concentration value without Field calibration adjustment,
Section 6.6.3
−
QF
or Quality Factor is a value in the range 0–200. It measures the image sharpness,
a typical good value is 100. A QF value below 40 usually indicates prism coating.
−
LED
is a measure of the amount of light from the light source in %. Should be below
100 %.
−
HD TMP
= sensor head temperature, see Section 5.4.4.
−
HD HUM
= sensor head humidity, see Section 5.4.5.
−
I_SNS
value shows the current to sensor, the nominal value is 40 mA.
−
DTR TMP
= Indicating transmitter temperature, see Section 5.4.4.