Turning Technologies TurningPoint User Manual
Page 222
TurningPoint for Office 2007 User Guide
222
Run a Presentation
Right-click on the Showbar and move your cursor across the Showbar to display each command’s name.
To activate the command, you can select the Showbar icon or use the respective Fn key on your
keyboard. Use the commands on the Showbar as follows:
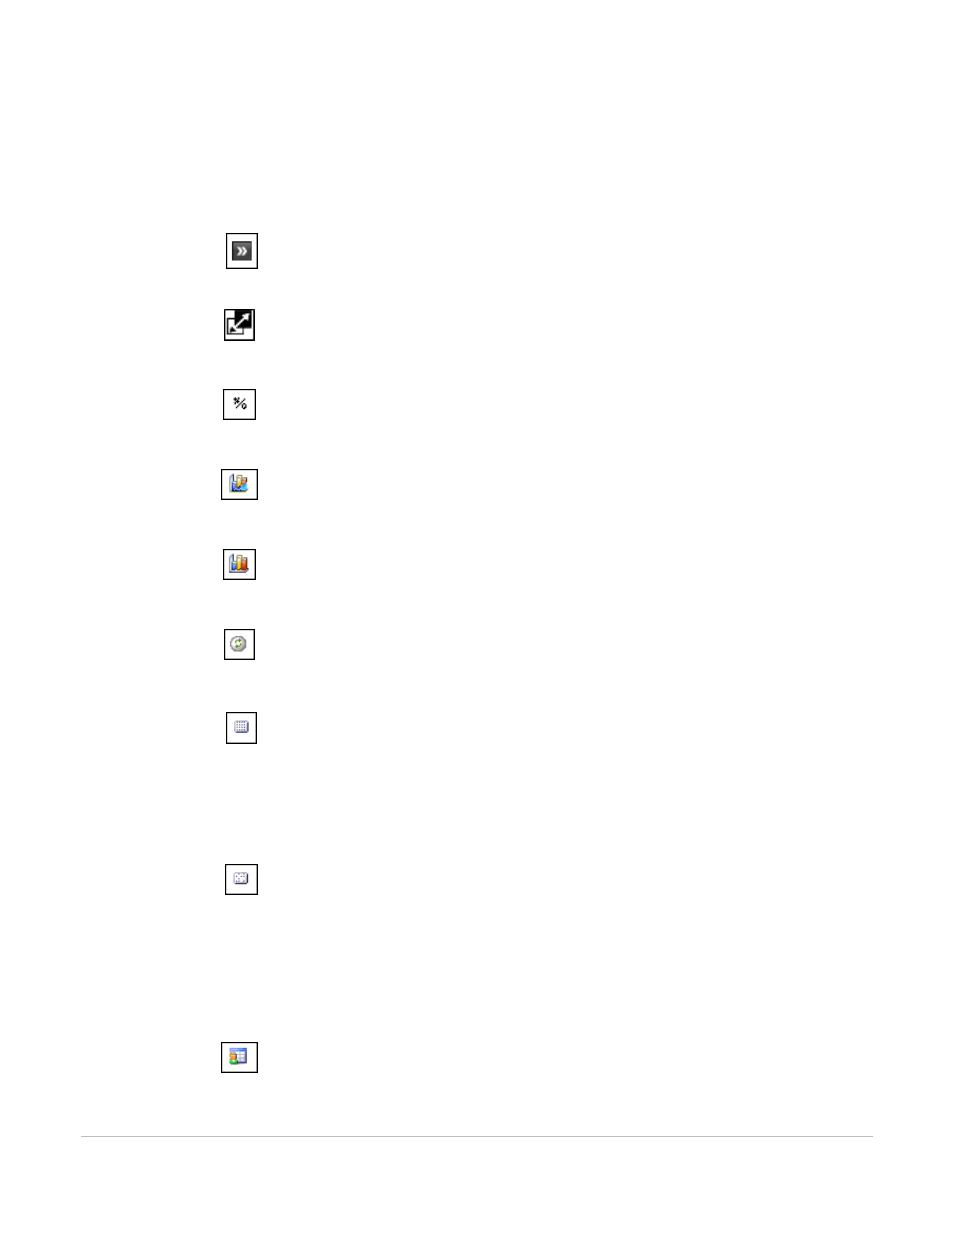
Shorten Showbar
Shortens the showbar and only displays Responses and
Polling Status.
F9-Show/Hide Showbar
Closes the Showbar for the duration of the current
presentation session.
F2-Toggle Results
Changes the values displayed on each chart. The values can
be represented as either numbers or percents.
F3-Data Slicing
Shows the responses on the chart for the portion of the
audience who chose a certain response on another question.
F6-Show the Original Chart
Use this command after using the Toggle Results or Data
Slicing commands to return the chart to its original
appearance.
F4-Repoll Question
Clears the responses and accepts new responses from the
audience for the currently displayed question. Both the
original responses and the new responses are stored in the
session file.
F7-Show the Response Grid
Opens a Response Grid on the screen allowing you to see
which participants have responded to the question.
The size, location, visual display, and contents of the grid are
controlled in the Presentation Settings. Find more information
about settings in Establish the Presentation Settings on
page 217.
F8-Show Non-Response Grid
Opens a Response Grid on the screen. As each participant
responds to a question, their response box is removed from
the grid.
The size, location, visual display, and contents of the grid are
controlled in the Presentation Settings. Find more information
about settings in Establish the Presentation Settings on
page 217.
F12-Display Participant Monitor
Opens the Participant Monitor. Find more information in Use
the Participant Monitor on page 225.