ADS Environmental Services IntelliServe 2.8.1 950026A7 User Manual
Page 98
5-24 IntelliServe
User’s Guide
CONFIDENTIAL – Covered by ADS Terms of Use and Confidentiality Agreement in Contract
© 2010 ADS LLC. All Rights Reserved.
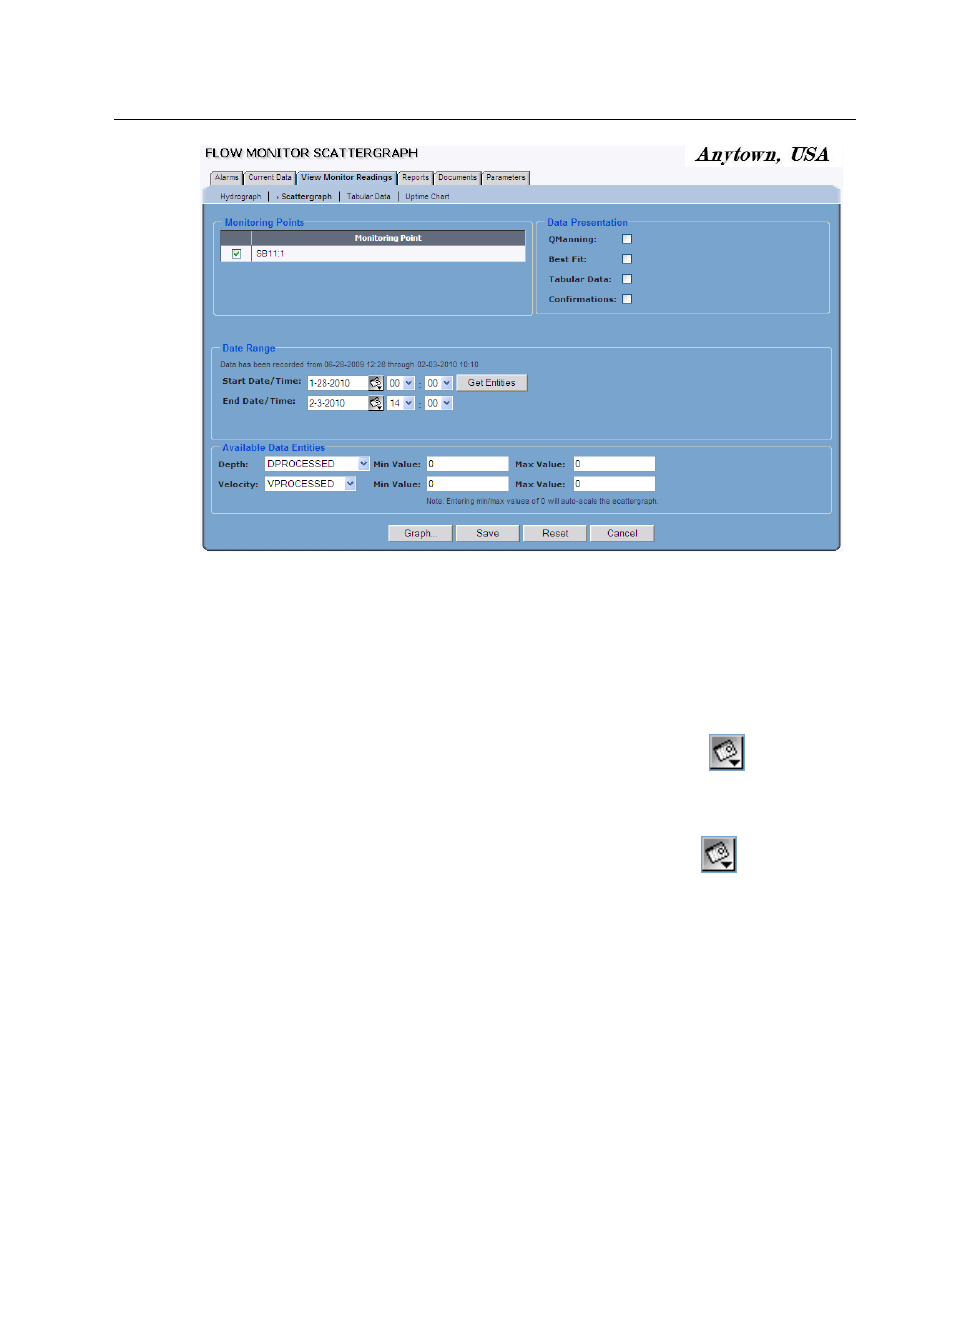
Flow Monitor Scattergraph window
4. Select the monitoring point(s) containing the data for which you want to
generate the scattergraph(s) from the Monitoring Points list.
5. Specify the time period for generating the scattergraph in the Date Range
section:
Start Date/Time Enter or click on the calendar icon
to select the
start date and then select the start time from the associated drop-down
lists.
End Date/Time Enter or click on the calendar icon
to select the
end date and then select the start time from the associated drop-down
lists.
6. Click on the Get Entities button to display the list of available entities with
data available for the selected time period.
The list of available entities appears in the Depth and Velocity drop-down lists.
Refer to Appendix B, Data Entities, for descriptions of the data entities.
7. (optional) Select the QManning checkbox to include the Manning curve on
the scattergraph.
8. (optional) Select the Best Fit checkbox to include the Best Fit curve
representing the plotted data points on the scattergraph.