ADS Environmental Services IntelliServe 2.8.1 950026A7 User Manual
Page 108
5-34 IntelliServe
User’s Guide
CONFIDENTIAL – Covered by ADS Terms of Use and Confidentiality Agreement in Contract
© 2010 ADS LLC. All Rights Reserved.
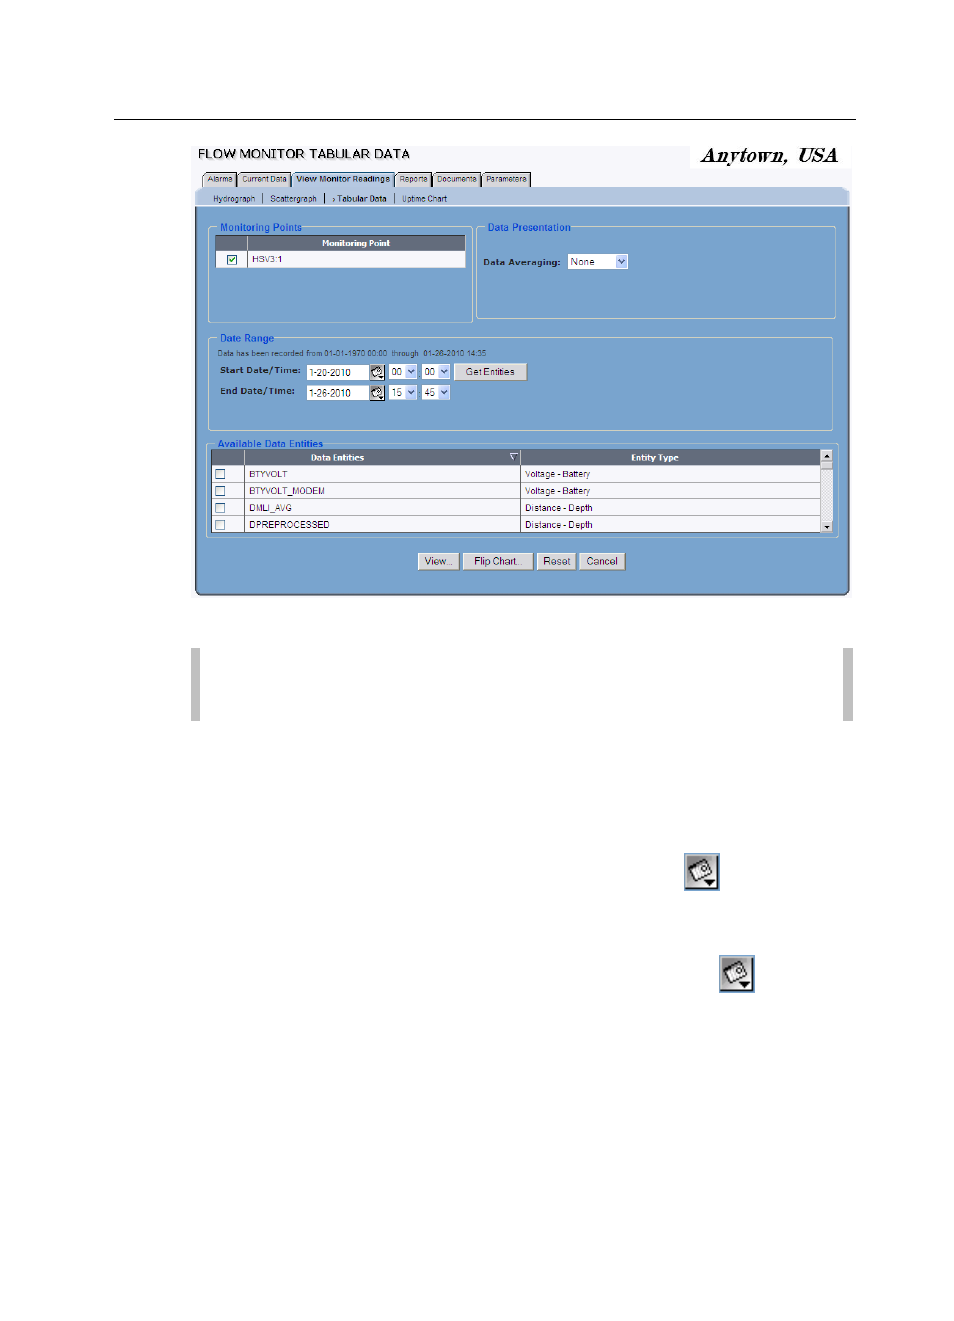
Flow Monitor Tabular Data window
Note: The Monitoring Point box displays the selected location. You
can select a different location if desired.
4. Select the checkbox(es) corresponding to the monitoring point(s) for which
you want to generate tabular data from the Monitoring Point list.
5. Specify the time period for which you would like to generate the table in the
Date Range section:
Start Date/Time Enter or click the calendar icon
to select the
start date and then select the start time from the associated drop-down
lists.
End Date/End Time Enter or click the calendar icon
to select
the end date and then select the start time from the associated drop-
down lists.
6. Select the interval at which you want to average the data on the hydrograph
from the Data Averaging drop-down list: