ADS Environmental Services IntelliServe 2.8.1 950026A7 User Manual
Page 110
5-36 IntelliServe
User’s Guide
CONFIDENTIAL – Covered by ADS Terms of Use and Confidentiality Agreement in Contract
© 2010 ADS LLC. All Rights Reserved.
Flip Chart Choose this button when you have selected multiple
monitoring points and want to display each one on a separate tabular
view. (There is no functionality when a single monitoring point is
viewed.) Use the scroll bars on the right and bottom of each tabular
page to scroll through data when more data is selected than can display
on the screen. Use the arrow buttons location in the corners of the
window to page through the different locations.
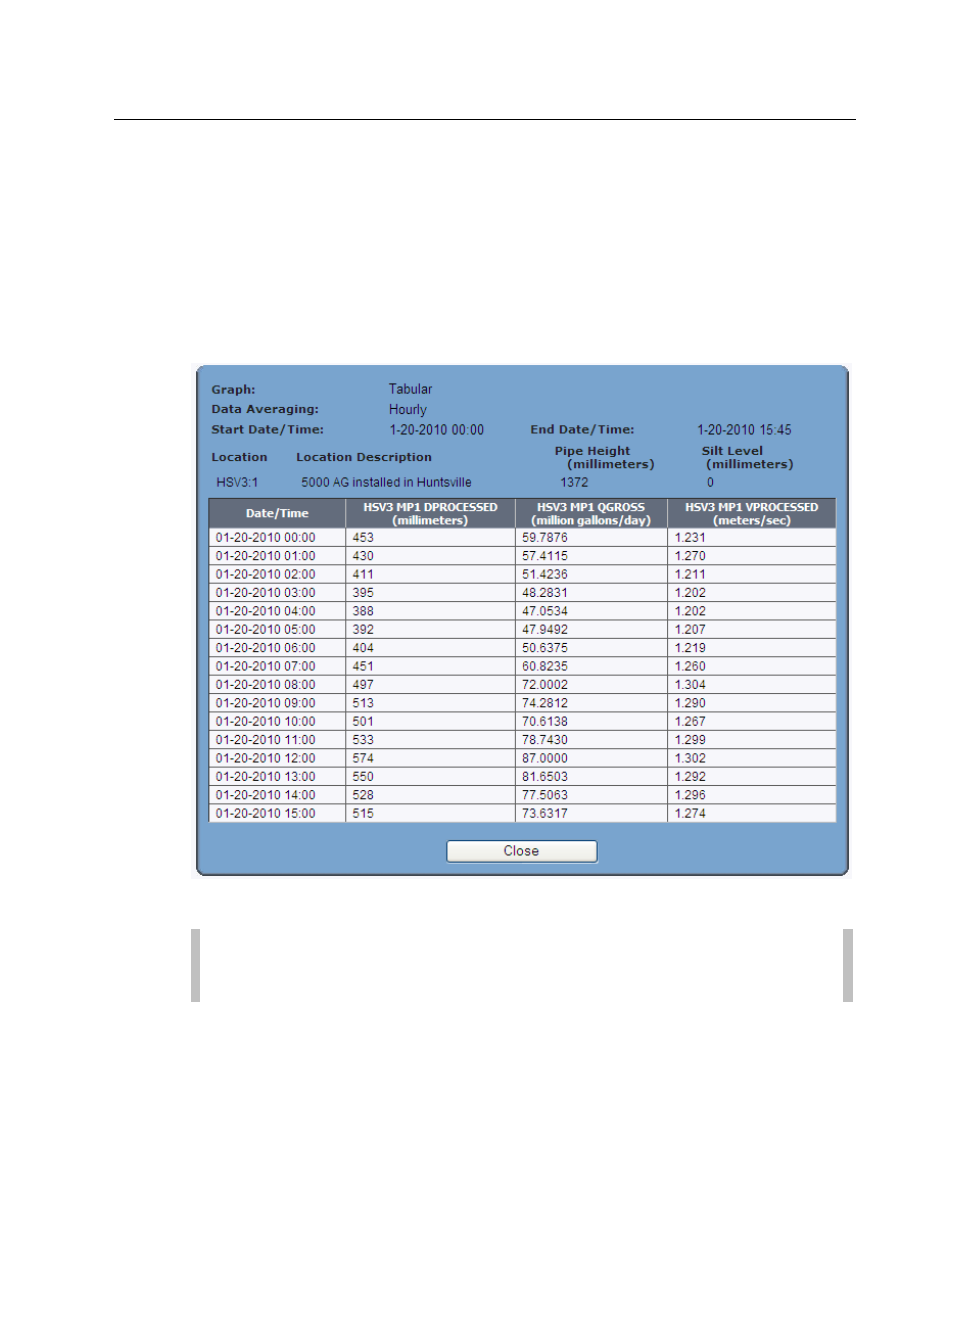
The entity data for the selected flow monitor(s) displays.
View Tabular Data dialog displaying the entity data
Note: An asterisk (*) displayed in place of a data value indicates that
no data was recorded for the corresponding time stamp.
10. (optional) Print the table by right-clicking on the table and selecting Print
from the drop-down menu or by selecting File > Print from the browser
menu panel.
11. Click on the Close button to return to the Flow Monitor Tabular Data
window.