Toggling between scattergraph and tabular views, Customizing the graph, Exporting the graph – ADS Environmental Services IntelliServe 2.8.1 950026A7 User Manual
Page 106: Printing the scattergraph
5-32 IntelliServe
User’s Guide
CONFIDENTIAL – Covered by ADS Terms of Use and Confidentiality Agreement in Contract
© 2010 ADS LLC. All Rights Reserved.
Toggling Between Scattergraph and Tabular Views
Selecting the Tabular radio button during the scattergraph setup in IntelliServe
allows you to toggle between a graphical and a tabular view of the data. Choose
the Graph radio button to view the data in the scattergraph view; choose the
Tabular radio button to view numerical, columnar data.
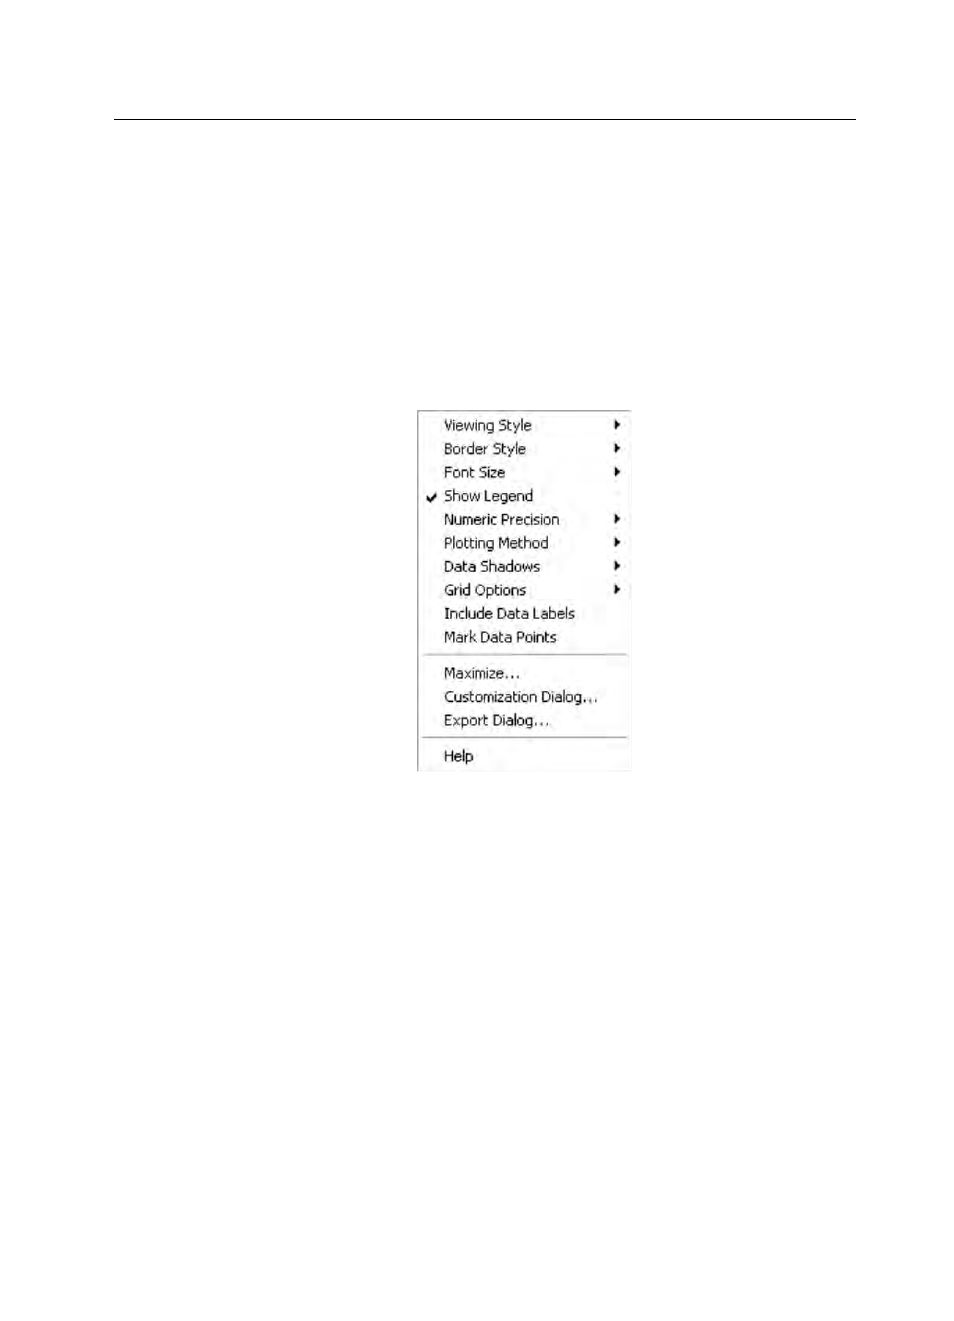
Customizing the Graph
Customize the way the graph displays into a variety of formats by right-clicking
on the graph and selecting from the options.
Customize Graph menu
Exporting the Graph
Export the graph into a variety of formats by right-clicking on the scattergraph
and selecting Export Dialog.
Printing the Scattergraph
Print the scattergraph or tabular data view by selecting File > Print from the
browser menu or by right-clicking on the scattergraph and selecting Print from
the options menu.