Showing active alarms, Plotting entity coordinates, Zooming – ADS Environmental Services IntelliServe 2.8.1 950026A7 User Manual
Page 95
Data Presentation 5-21
CONFIDENTIAL – Covered by ADS Terms of Use and Confidentiality Agreement in Contract
© 2010 ADS LLC. All Rights Reserved.
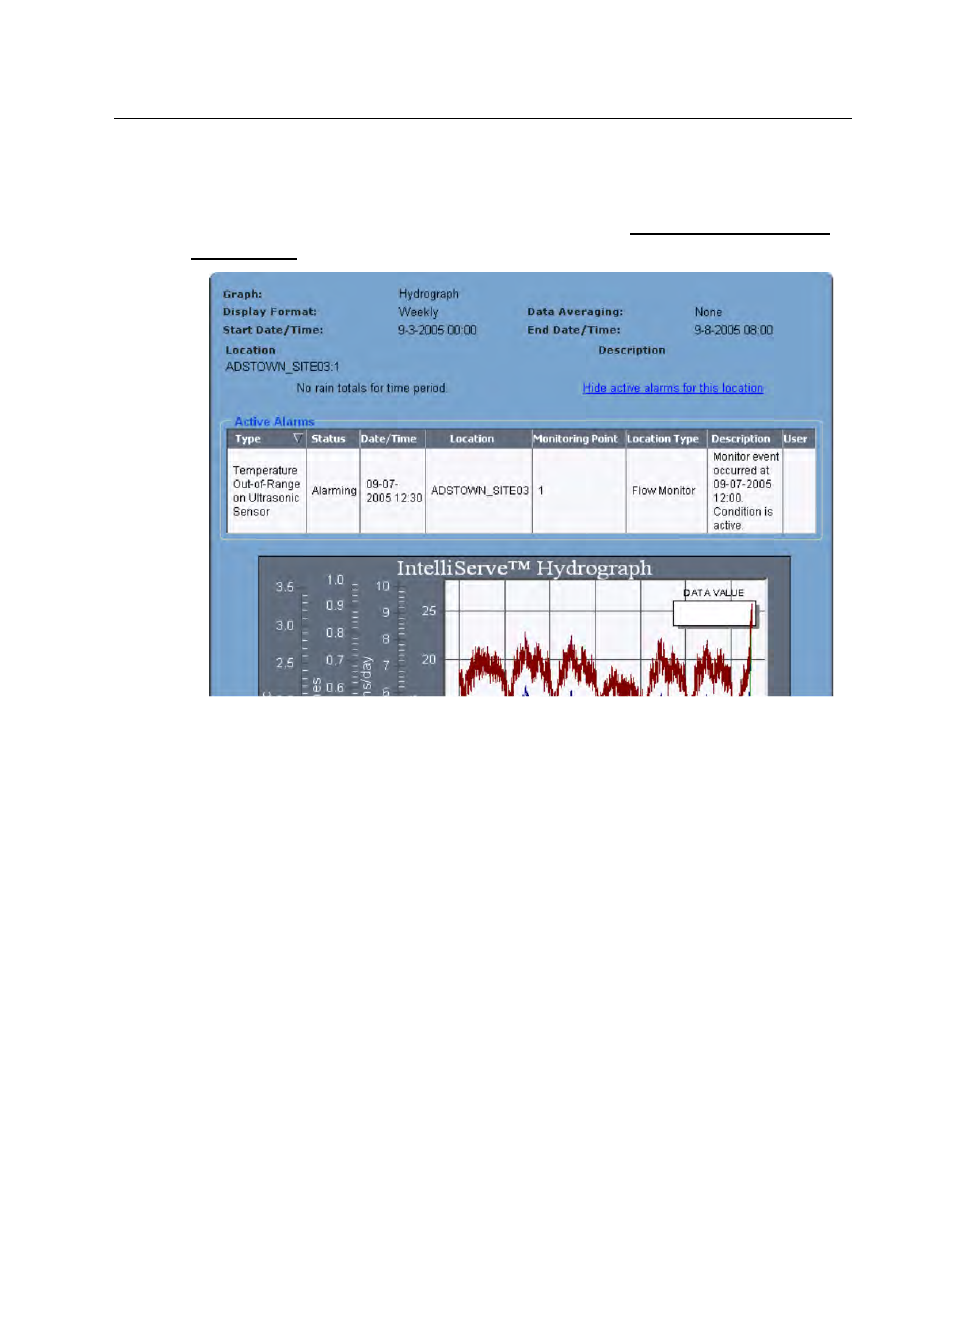
Showing Active Alarms
If any alarms currently exist for the location for which you are viewing
hydrograph data, you can view the alarms by clicking Show active alarms for
this location. Sort the active alarms table by clicking on the column headings.
Active alarms
Plotting Entity Coordinates
The Data Value box in the upper right corner of the graph displays the x- and y-
axis value for a point you select from the curve.
Zooming
Enlarge an area of the graph for better viewing by clicking and dragging a
rectangle over the area of interest. Return the view to its original size by right-
clicking the mouse on the graph and selecting Undo Zoom.