ADS Environmental Services IntelliServe 2.8.1 950026A7 User Manual
Page 116
5-42 IntelliServe
User’s Guide
CONFIDENTIAL – Covered by ADS Terms of Use and Confidentiality Agreement in Contract
© 2010 ADS LLC. All Rights Reserved.
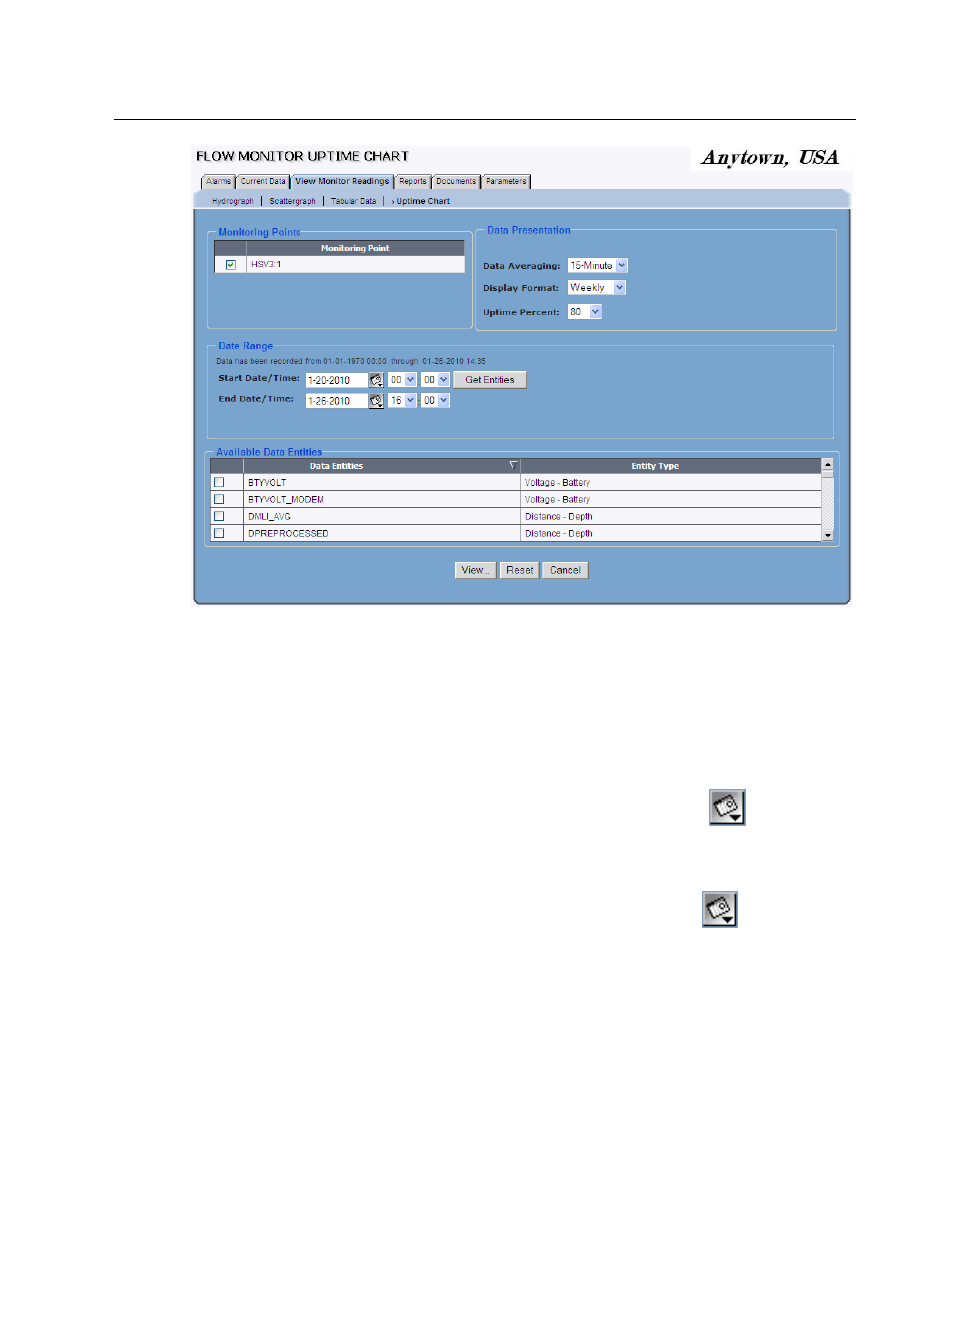
Flow Monitor Uptime Chart window
4. Select the checkbox(es) corresponding to the monitoring point(s) for which
you want to generate the chart from the Monitoring Points section.
5. Designate the date and time period over which to display uptime data from
the Date Range section.
Start Date/Time Enter or click on the calendar icon
to select the
start date and then select the start time from the corresponding drop-
down lists.
End Date/Time Enter or click on the calendar icon
to select the
end date and then select the end time from the corresponding drop-
down lists.
6. Click on the Get Entities button to display the entity data that is available in
the database for the selected date/time range.
The Available Data Entities section displays the entities from the monitoring
point(s) for which data exists in the database for the selected date/time range.