ADS Environmental Services IntelliServe 2.8.1 950026A7 User Manual
Page 132
5-58 IntelliServe
User’s Guide
CONFIDENTIAL – Covered by ADS Terms of Use and Confidentiality Agreement in Contract
© 2010 ADS LLC. All Rights Reserved.
7. Select the checkboxes in the Available Data Entities section corresponding
to the entities for which you want to view pump time data.
8. Select the period over which you want IntelliServe to display the data on
the screen at one time from the Display Format drop-down list.
9. (optional) Select the Tabular Data checkbox to include an option on the
hydrograph(s) for viewing the data in tabular format.
10. Click on the Graph button to display the pump time data on a hydrograph
based on the selected parameters. For multiple monitoring points, you can
select the Flip Chart button instead to view data for each monitoring point
on a separate hydrograph. Otherwise, IntelliServe will display the data for
both monitoring points on one hydrograph.
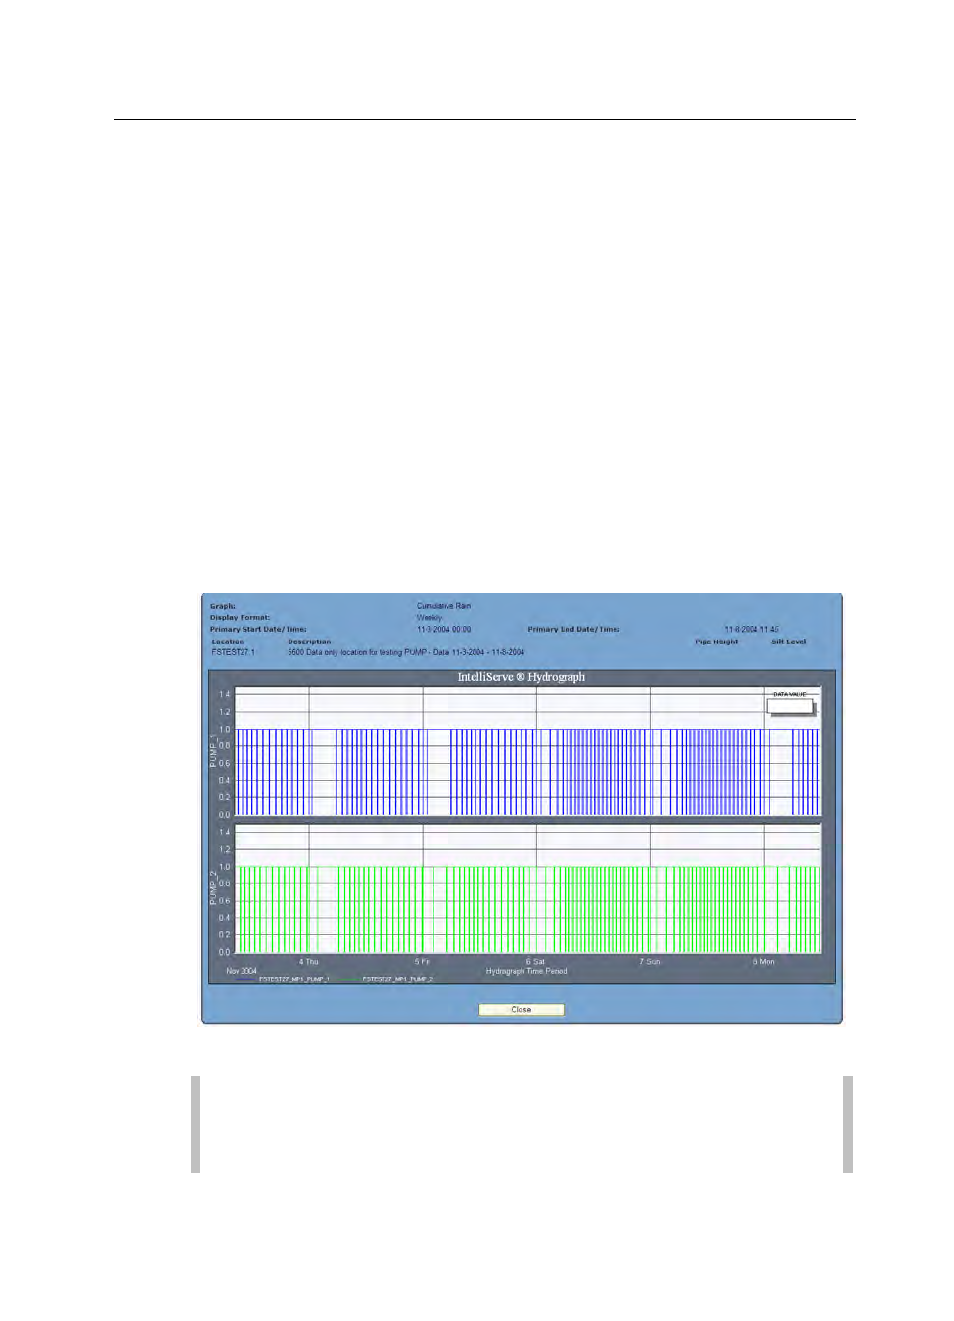
An IntelliServe Hydrograph dialog displays the selected pump time data in the
chosen format. Use the scroll bar at the bottom of the hydrograph to scroll
through the data if more data has been selected than can display on the screen
at one time. For multiple hydrographs, move between the graphs using the
arrow buttons or by clicking on the number link directly above the hydrograph.
Pump Times graph for selected monitor location
Note: Refer to Hydrograph Display Options beginning on page 5-18
for instructions on toggling between the graphical and tabular views and
customizing, exporting, or printing the graph.