ADS Environmental Services IntelliServe 2.8.1 950026A7 User Manual
Page 117
Data Presentation 5-43
CONFIDENTIAL – Covered by ADS Terms of Use and Confidentiality Agreement in Contract
© 2010 ADS LLC. All Rights Reserved.
7. Select the checkboxes on the Available Data Entities table corresponding
to the entities you want to include on the uptime chart. Refer to Appendix B,
Data Entities, for brief descriptions of the entities supported in IntelliServe.
8. Select the interval at which to average the data for the uptime chart from the
Data Averaging drop-down list. ADS recommends using the same interval
in which the data is stored.
9. Select the period over which to display the data on the screen from the Data
Format drop-down list.
10. Select the percentage of available readings an entity must have, at a
minimum, for a day to receive a Good rating from the Uptime Percent
drop-down list. Good is the highest rating available.
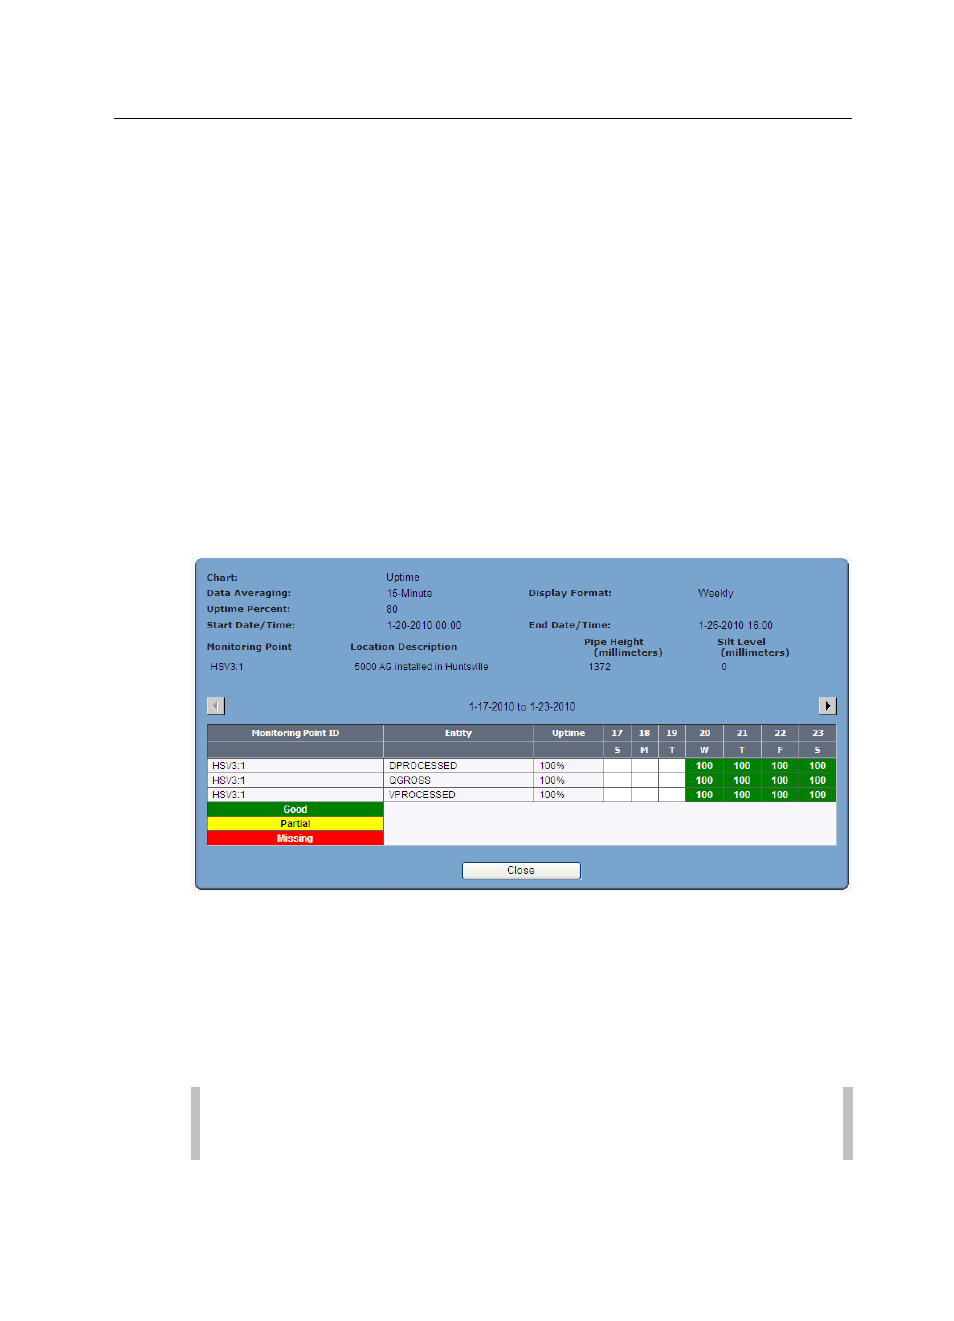
11. Click on the View button to display an uptime chart for the selected entities
and date/time range.
The uptime chart displays for the selected entities and date/time range.
View Uptime Chart for a flow monitor location
12. (optional) Print the uptime chart by selecting File > Print from the browser
menu or by right clicking outside the image area and selecting the Print
option.
13. Click on the Close button to return to the Flow Monitor/Rain Gauge
Uptime Chart screen.
Note: Clicking the Reset button resets the uptime chart parameters to
the default settings.