Click ok – Rockwell Automation FactoryTalk Historian SE ProcessBook 3.2 User Guide User Manual
Page 281
7
●
Data Streams
●
●
●
●
●
263
4. Click the Tag Search arrow, and then click PI calculation. The PI
Calculation Data dialog box appears.
If you want to display the ODBC Data dialog box instead of the PI
Calculation Data dialog box, then click the Tag Search arrow, and then
select ODBC.
5. Under Saved Data Sets, click the data set you want to add to the
trend.
6. Under Data Set Columns, select a column(s) to be plotted in the trend
(use the SHIFT or CTRL keys to select more than one column).
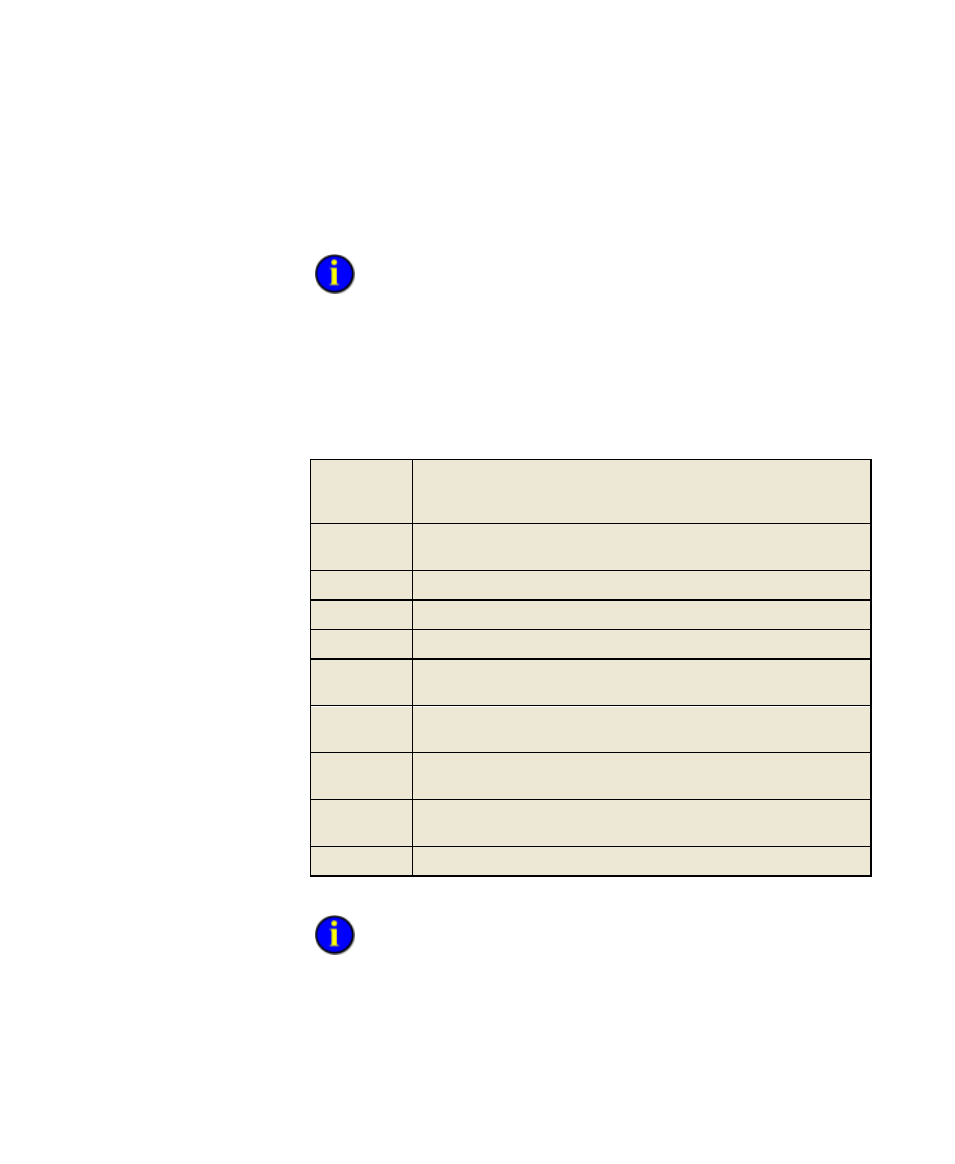
Value
Value of the expression for the calculation interval and type as of the
time stamp. In the case of summary data sets, this column holds the
value of the tag.
Total
The totalized value (time integral) of a tag over a given time,
according to values stored in the archive.
Average
Average value of the expression for the calculation interval and type.
Minimum
Minimum value of the expression for the calculation interval and type.
Maximum
Maximum value of the expression for the calculation interval and type.
PctGood
The time percentage, over a given range, when a tag's archived
values are good (not digital states).
Range
The difference between a tag's maximum and minimum values during
a given time, according to values stored in the archive.
StdDev
The time-weighted standard deviation of a tag over a given time,
according to values stored in the archive.
PStDev
The standard deviation of two or more arguments, where those
arguments represent the whole population.
Count
The number of events for a point over a given time.
7. Click OK.
Until you select a data set and at least one column, the OK button is
dimmed.