Grid line labels, Value scale grid lines – Rockwell Automation FactoryTalk Historian SE ProcessBook 3.2 User Guide User Manual
Page 142
●
●
●
●
●
FactoryTalk Historian ProcessBook User Guide
124
Grid Line Labels
Configure the labels for the value scale using single or multiple scales. You
can place these labels on either the inside or outside of the value axis:
Single Scale
The union of the ranges for all traces appears in the label.
Multiple Scales
The range for each trace in the trend appears in the label.
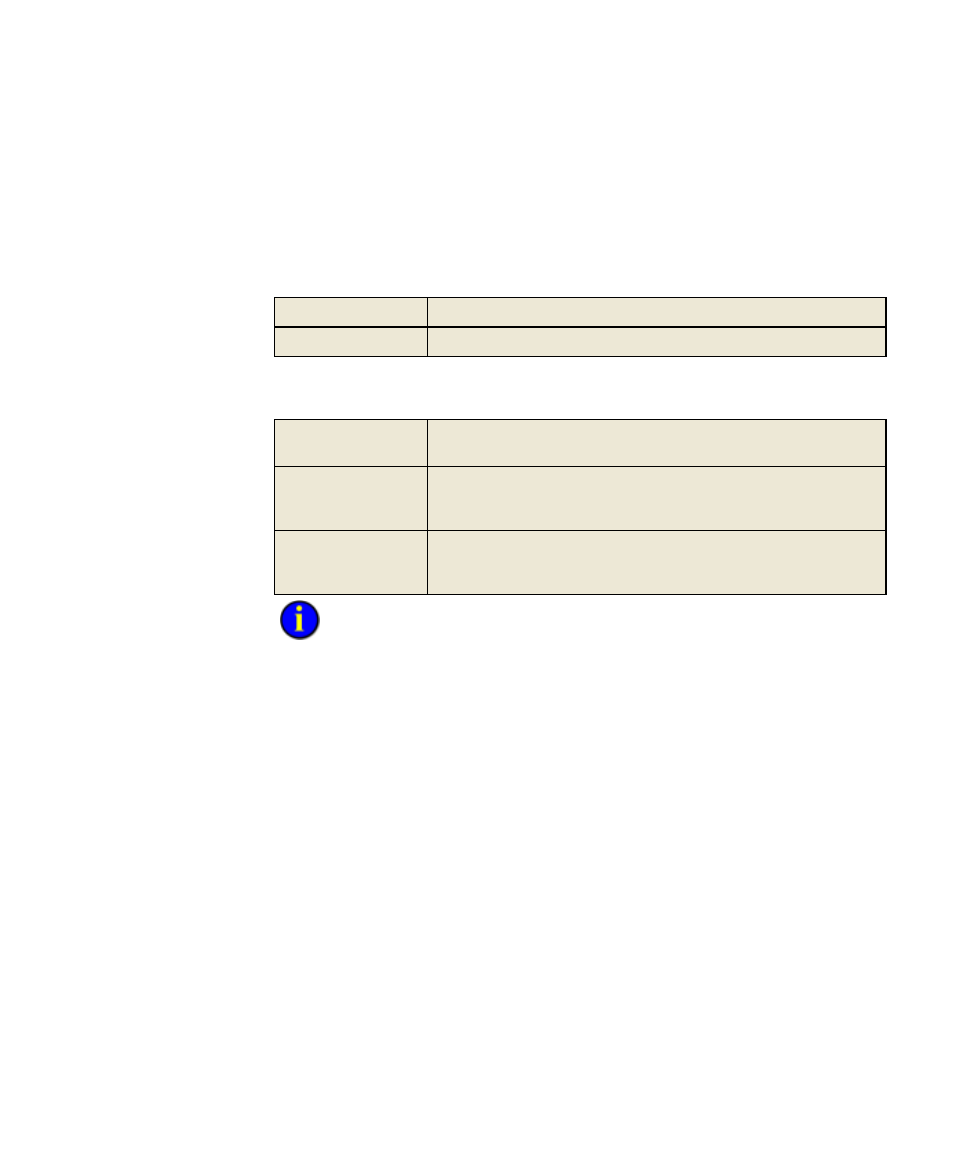
Configure the labels for the time axis using a full time stamp, partial time
stamp, or a relative time stamp:
Full timestamp
Displays a complete time stamp for the start and end times. The time
range of the trend is in the middle of the time axis.
Partial timestamp
Labels most grid lines in the units of the time range. Displays the full
time stamp for the end time of the trend at the top right edge of the
plot.
Relative timestamp Displays the offset from the end time limit in weeks, days, hours, etc.
and the full time stamp for the end time of the trend at the top right
edge of the plot.
Labels for the grid lines appear unless the trend rectangle is too small.
Value Scale Grid Lines
Grid lines are shown in value scale intervals of 1, 2, 5, 10, or powers of 10
times those intervals.
The value axis minimum and maximum are set one of four methods: